Fig. 4
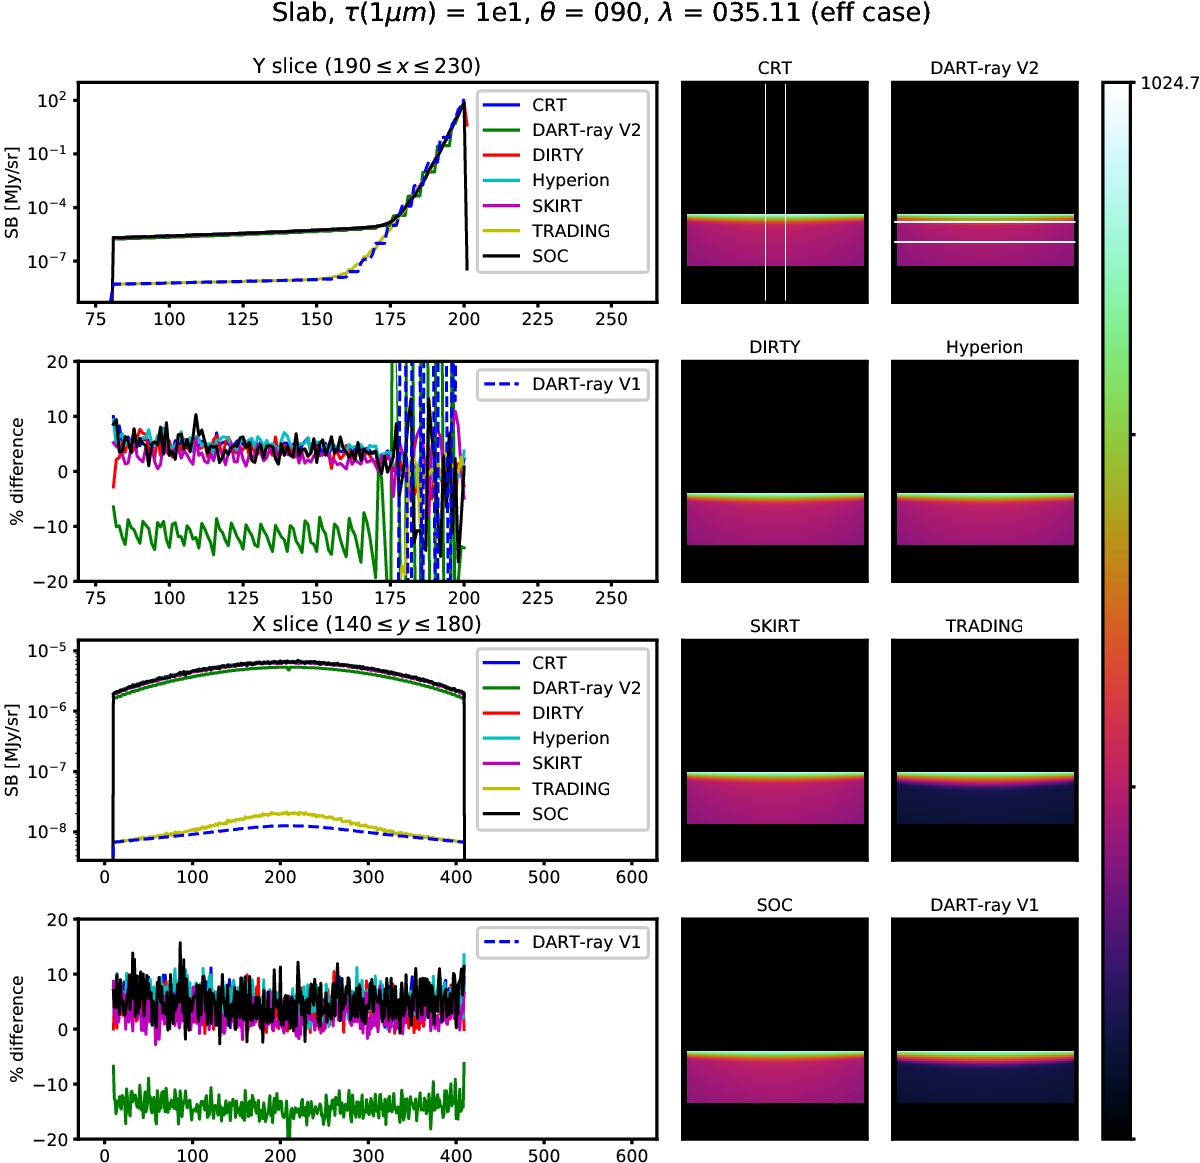
Comparison of the λ = 35.11 μm edge-on images of the TRUST slab benchmark for the vertical optical depth τ(1 μm) = 10. The solutions provided by the old and new DART-Ray version are included as well as those of the other codes participating to the project. Units on the images are MJy/sr. The plots on the left show the average surface brightness profiles and the relative differences between the solutions along a vertical and a horizontal strip, whose boundaries are shown within the top two images (CRT and new DART-Ray code). The X-axis of these plots are in units of pixels. The inclusion of dust self-heating in the new version of DART-Ray allows a much closer agreement with the other codes. We note that these solutions are for the “effective grain” case (see G17).
Current usage metrics show cumulative count of Article Views (full-text article views including HTML views, PDF and ePub downloads, according to the available data) and Abstracts Views on Vision4Press platform.
Data correspond to usage on the plateform after 2015. The current usage metrics is available 48-96 hours after online publication and is updated daily on week days.
Initial download of the metrics may take a while.