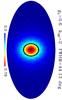
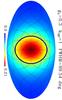
Fig. 2
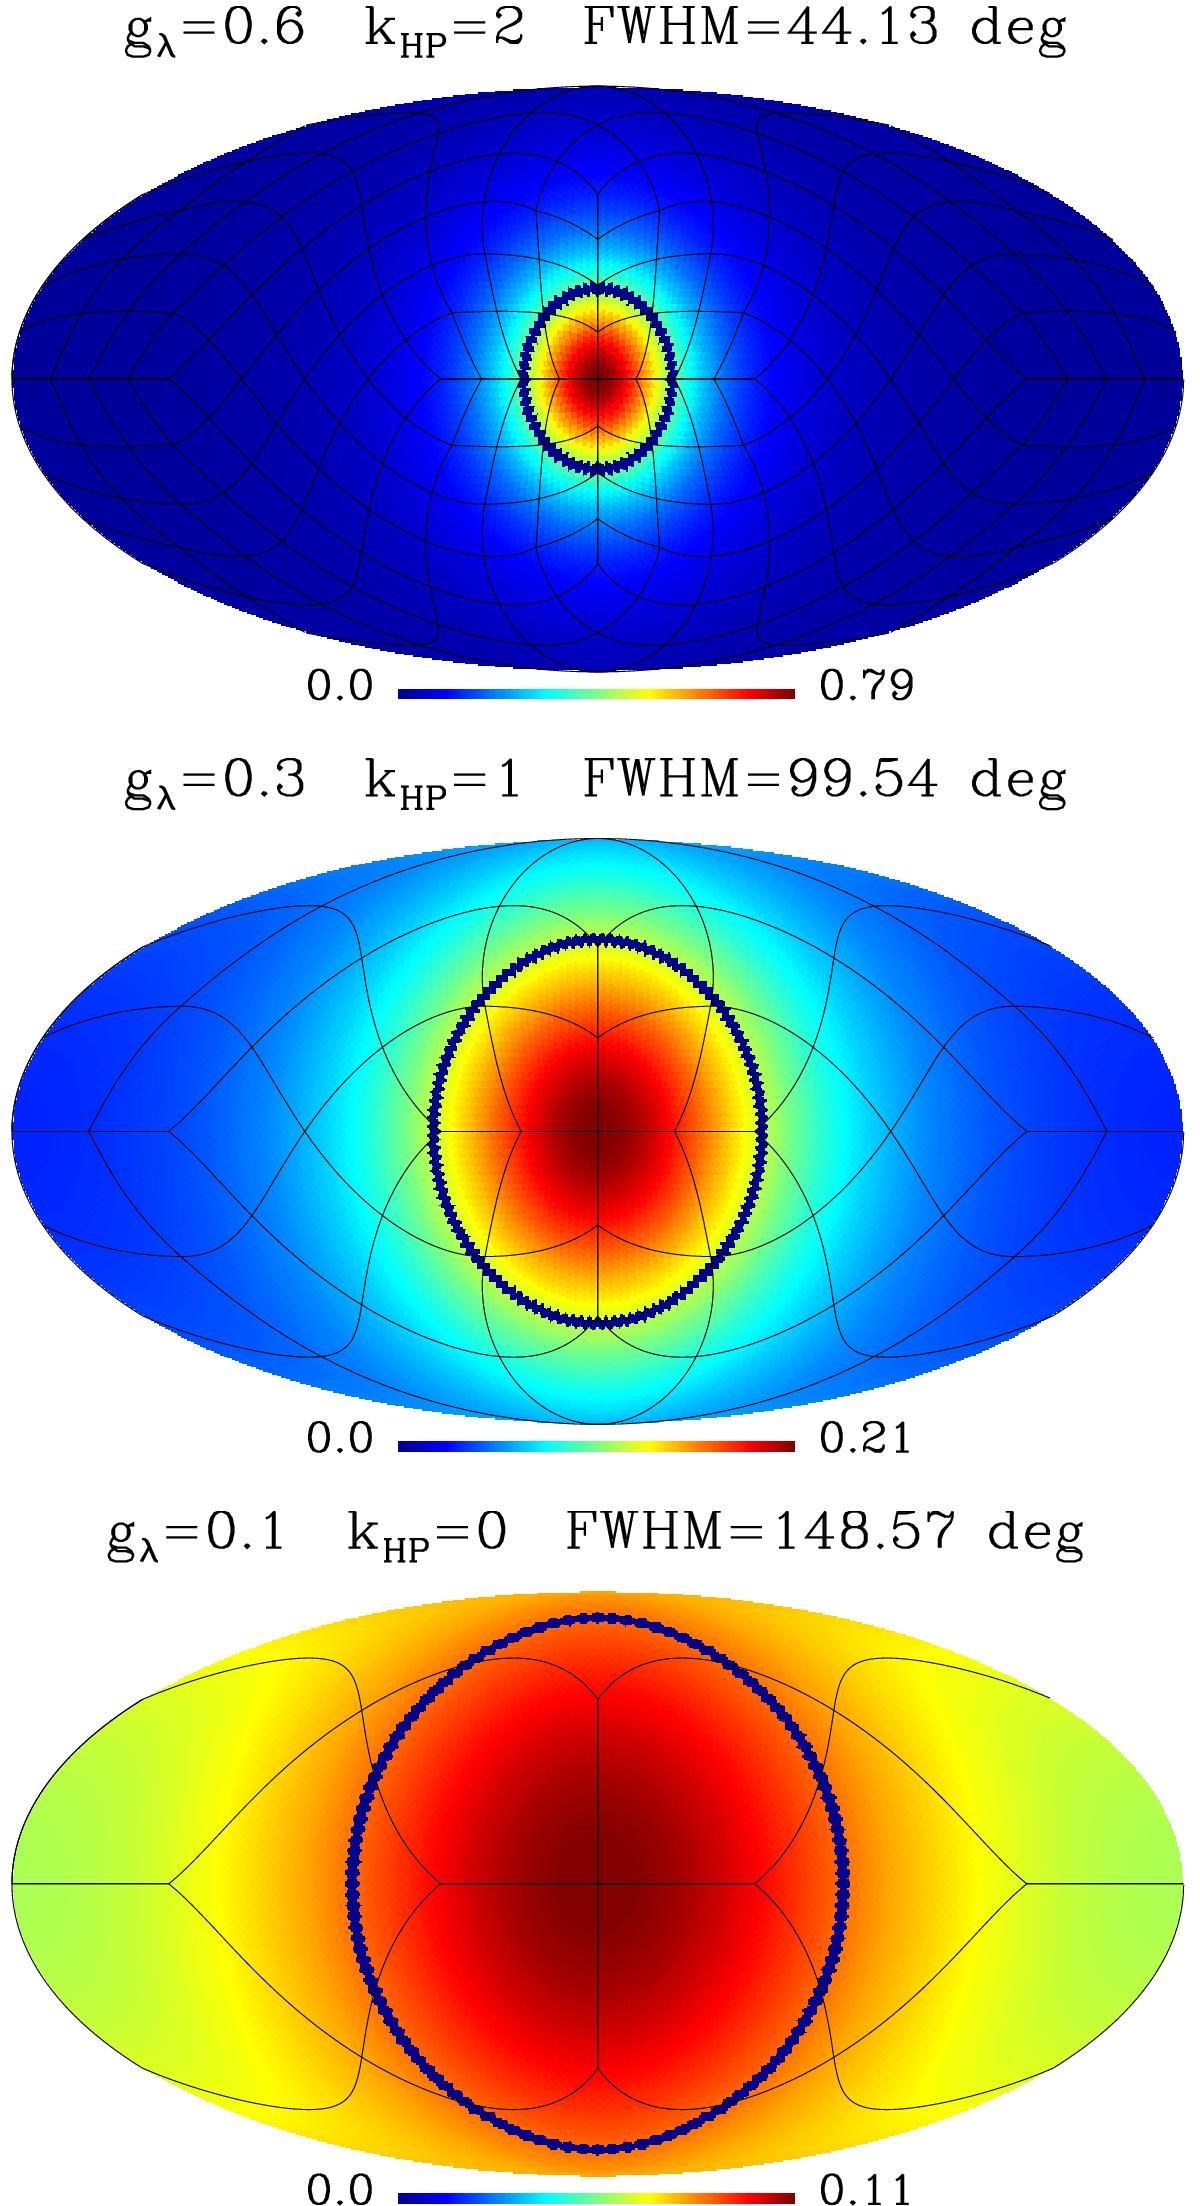
Examples of the implemented sampling of the Henyey-Greenstein phase function Φλ for different values of the anisotropy parameter gλ. The Φλ values on a sphere are visualized using Mollweide projection and according to the colour bar below each panel. The contours of the HEALPix pixels corresponding to the values of kλ,HP from Eq. (5) are overplotted as black lines. The dark blue circle shows the size of the FWHM [ Φλ−Φλ(π) ].
Current usage metrics show cumulative count of Article Views (full-text article views including HTML views, PDF and ePub downloads, according to the available data) and Abstracts Views on Vision4Press platform.
Data correspond to usage on the plateform after 2015. The current usage metrics is available 48-96 hours after online publication and is updated daily on week days.
Initial download of the metrics may take a while.