Fig. 1
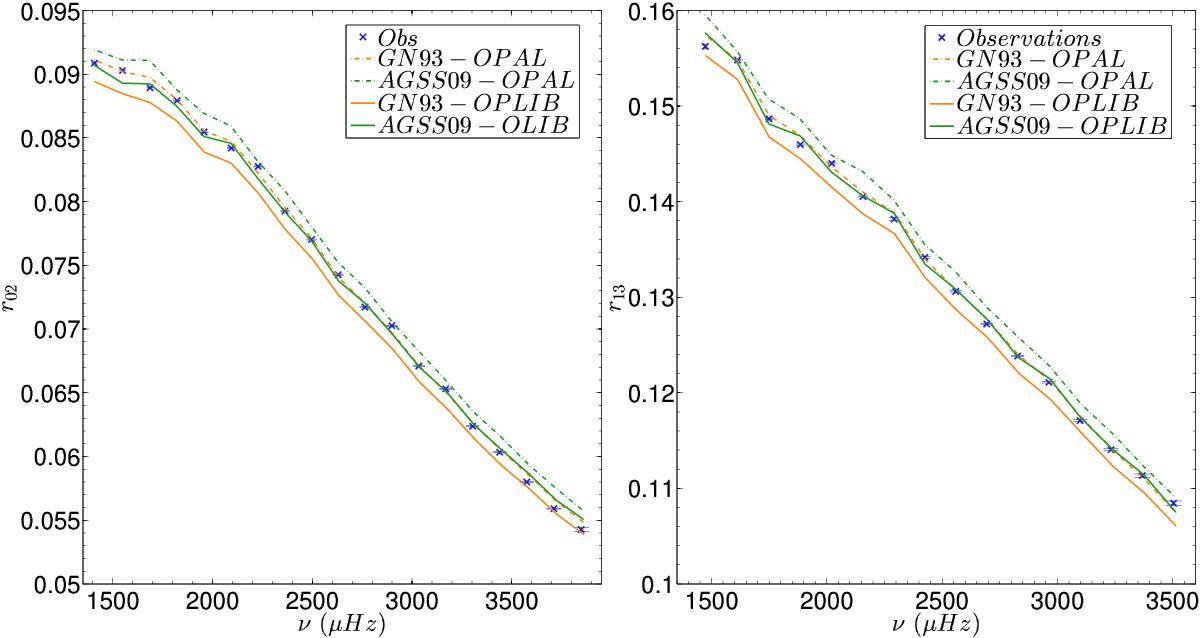
Frequency ratios r02 and r13 for the Sun and two SSMs. The observations are given with their error bars in blue, while the dashed green line shows the results for an SSM built using the OPAL opacities, the Free equation of state and the AGSS09 abundance tables. The dashed orange line shows the values of these ratios for an SSM built with GN93 abundances, the OPAL opacities and the Free equation of state. The solid green and orange lines show the ratio values when using the OPLIB opacities instead of the OPAL opacities for the AGSS09 and GN93 abundances respectively.
Current usage metrics show cumulative count of Article Views (full-text article views including HTML views, PDF and ePub downloads, according to the available data) and Abstracts Views on Vision4Press platform.
Data correspond to usage on the plateform after 2015. The current usage metrics is available 48-96 hours after online publication and is updated daily on week days.
Initial download of the metrics may take a while.