Fig. 6
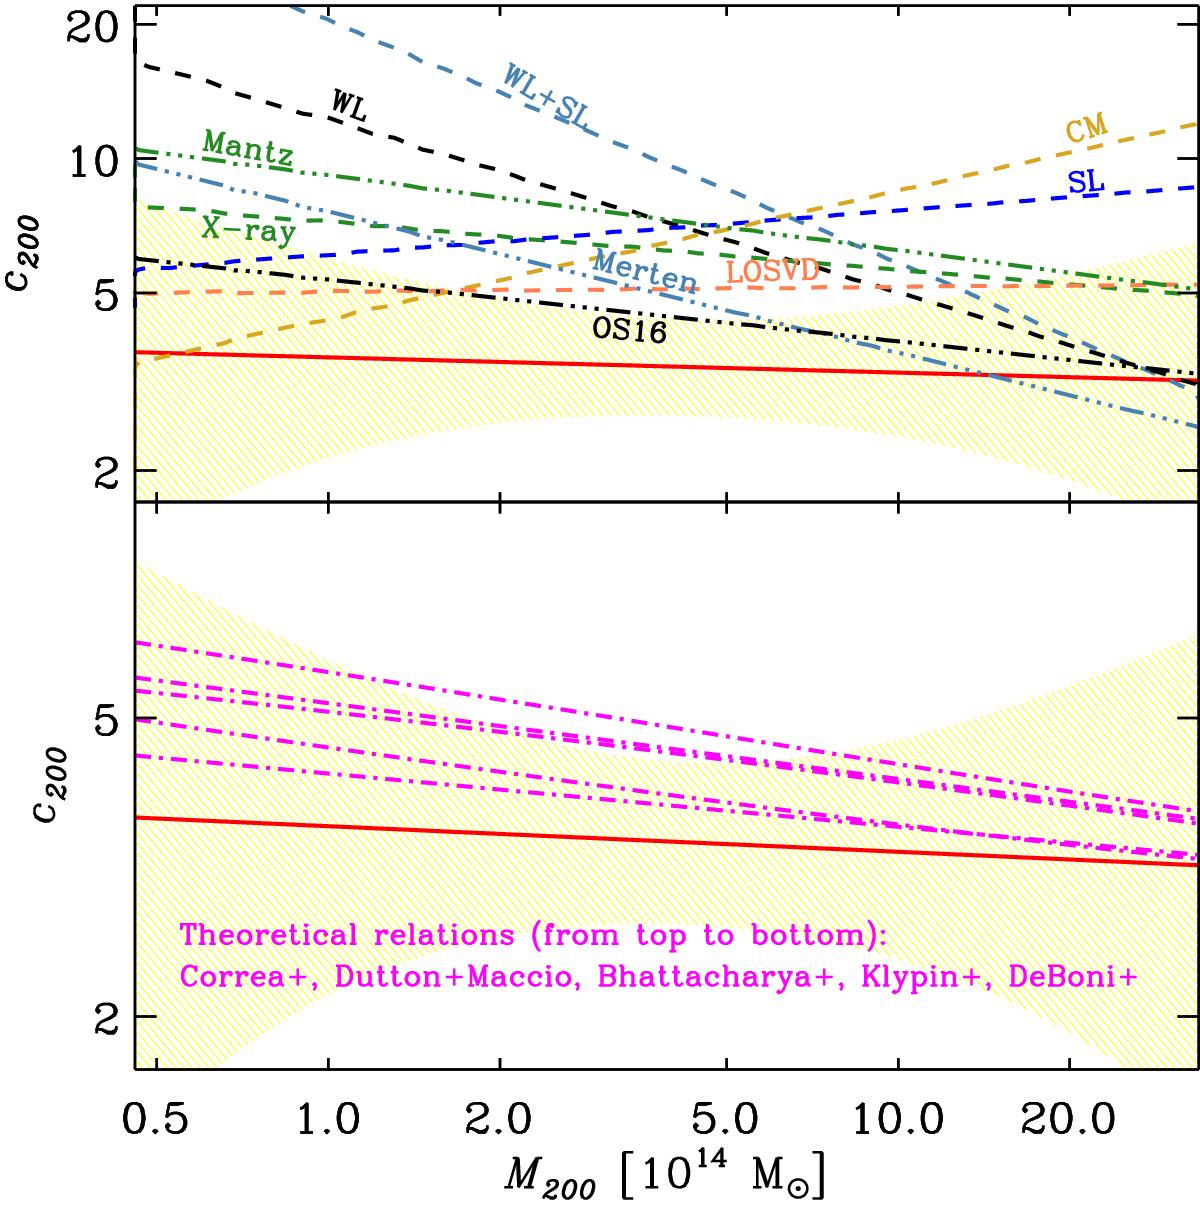
Best-fit cMr from Eq. (13) and Fig. 4 (red solid line; yellow shading indicates the 68% confidence region), compared to other observational and theoretical cMr determinations. Upper panel: comparison with other observational determinations of the cMr: Mantz et al. (2016, triple-dot-dashed green line labeled “Mantz”), Merten et al. (2015, tripled-dot-dashed steel blue line, labeled “Merten”), Okabe & Smith (2016, triple-dot-dashed black line, labeled “OS16”), and Groener et al. (2016, dashed lines labeled as in Fig. 2 of their paper). Bottom panel: comparison with theoretical determinations of the cMr; from top to bottom: Correa et al. (2015), Dutton & Macciò (2014), Bhattacharya et al. (2013), Klypin et al. (2016), De Boni et al. (2013).
Current usage metrics show cumulative count of Article Views (full-text article views including HTML views, PDF and ePub downloads, according to the available data) and Abstracts Views on Vision4Press platform.
Data correspond to usage on the plateform after 2015. The current usage metrics is available 48-96 hours after online publication and is updated daily on week days.
Initial download of the metrics may take a while.