Fig. 3
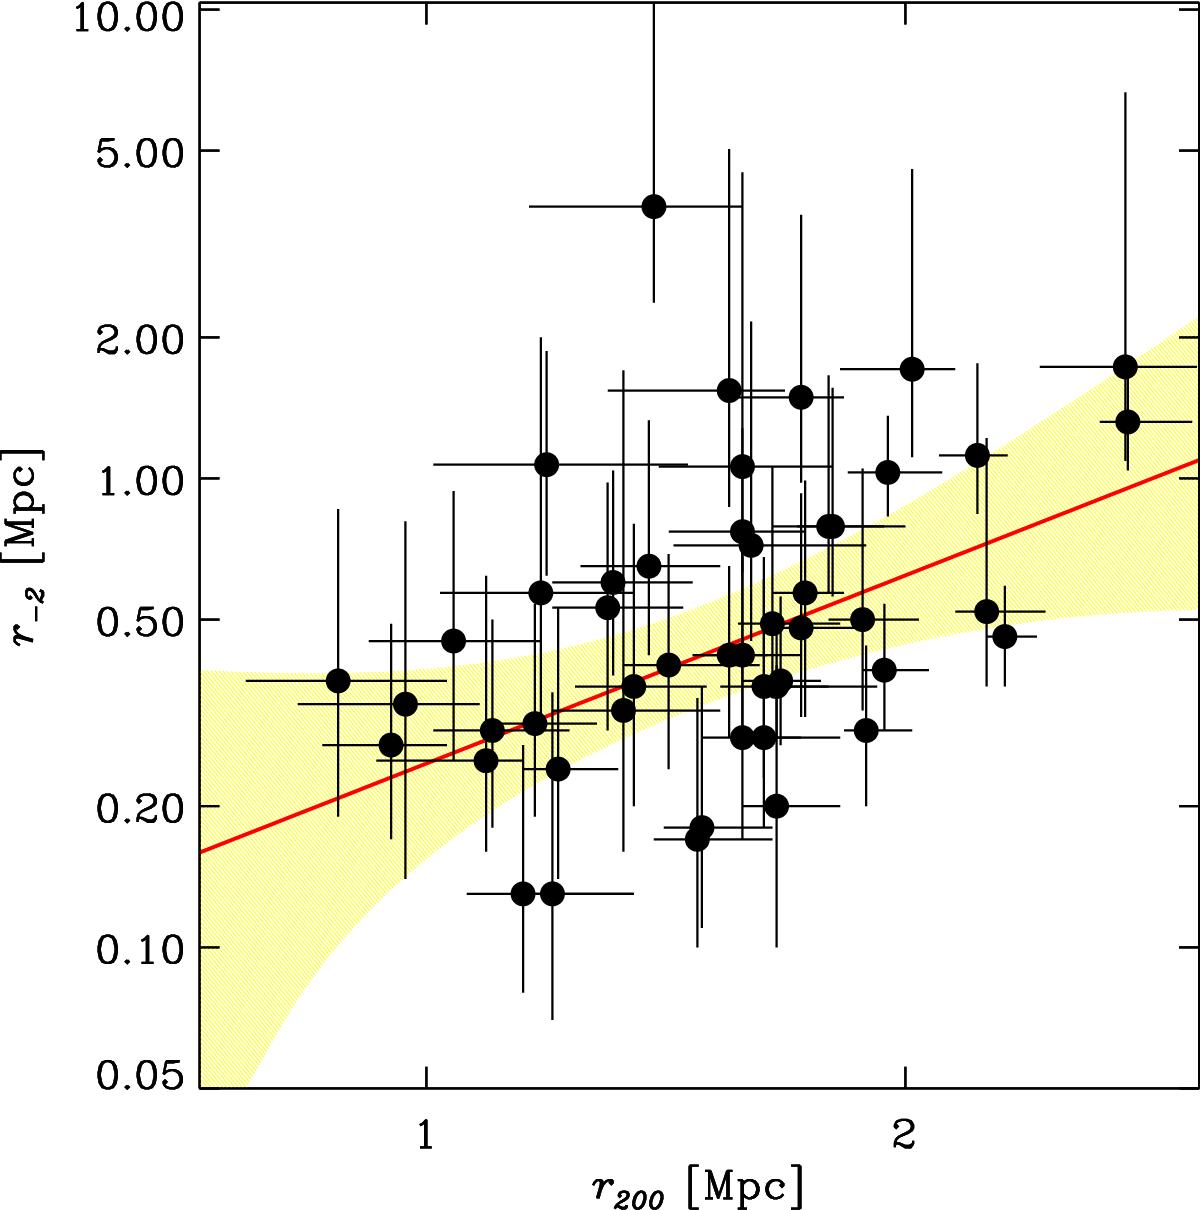
Scale-radii r-2 vs. virial radii r200, as obtained from the MAMPOSSt dynamical analysis, for the 49 clusters in our sample (Eq. (11)). Error bars indicate marginalized 68% confidence levels on the measured values. The solid (red) line indicates the best-fit log-log orthogonal relation between the two quantities, and the (yellow) shaded region its 68% confidence region, obtained using the IDL code confidence_band. The best fit was obtained using the fitting procedure of Williams et al. (2010).
Current usage metrics show cumulative count of Article Views (full-text article views including HTML views, PDF and ePub downloads, according to the available data) and Abstracts Views on Vision4Press platform.
Data correspond to usage on the plateform after 2015. The current usage metrics is available 48-96 hours after online publication and is updated daily on week days.
Initial download of the metrics may take a while.