Fig. 2
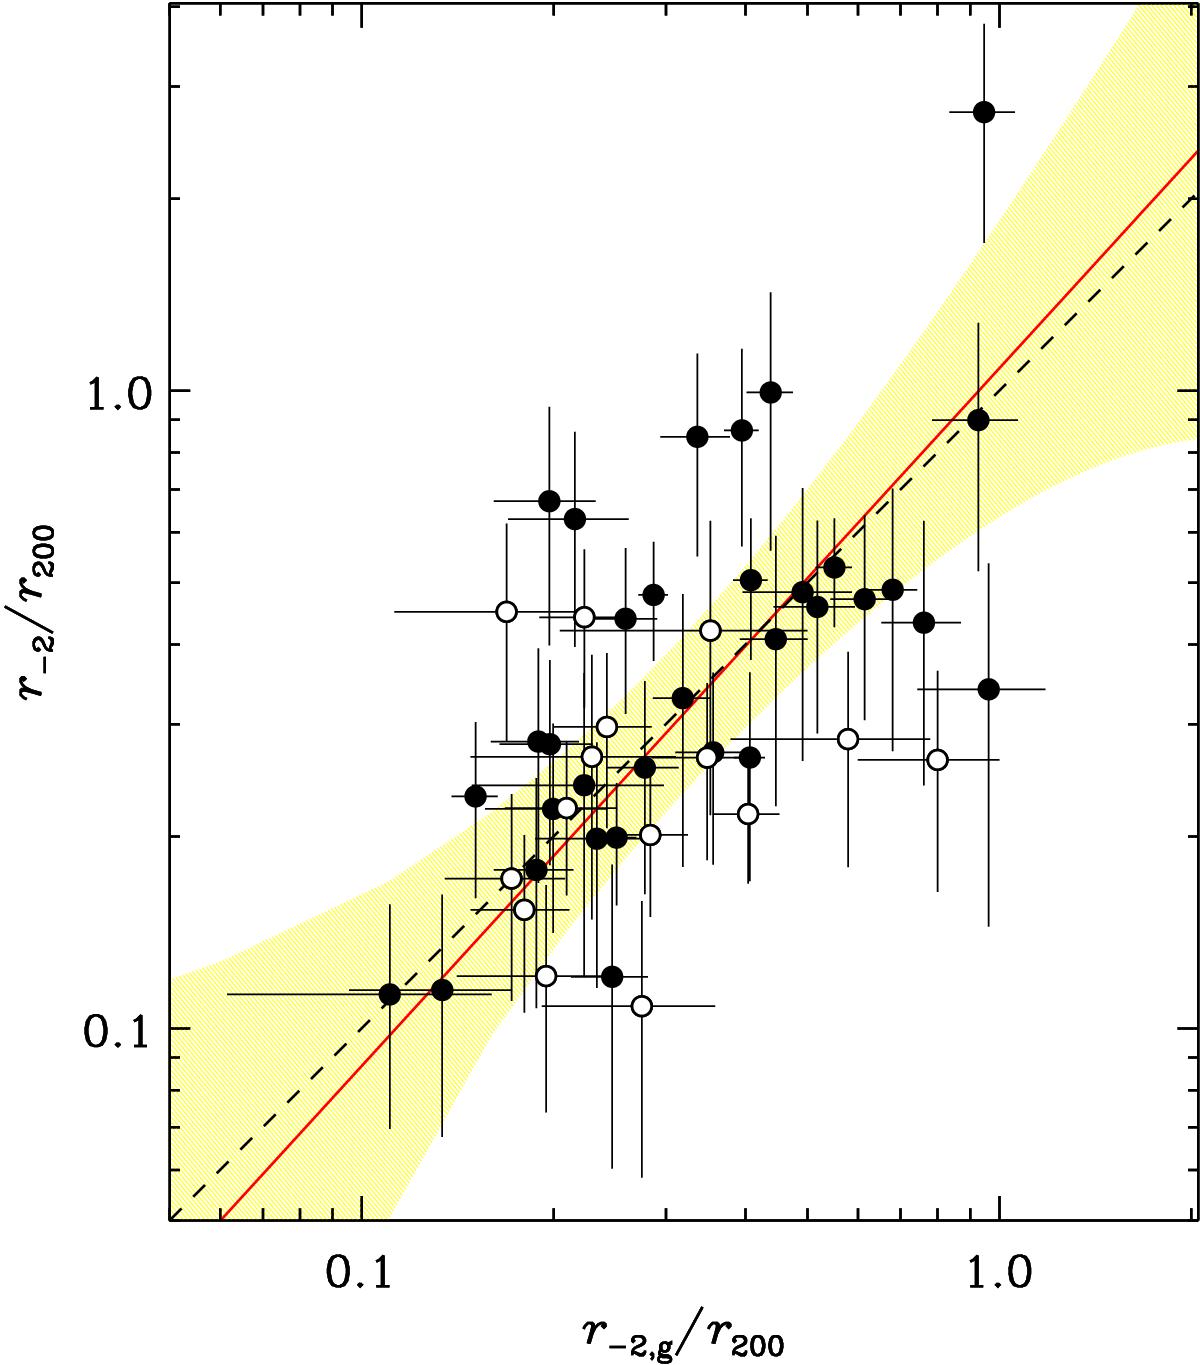
Scale radii of the total cluster mass density profiles, in units of the virial radii (r-2/r200 on the y-axis) vs. scale radii of the galaxy number density profiles, in the same units (r− 2,g/r200 on the x-axis). The error bars are 68% confidence levels, but do not include the uncertainties on r200, given that the same quantity is used to normalize both variables on the two axes. The dashed line indicates the identity relation r-2 ≡ r− 2,g. The solid (red) line indicates the best-fit log-log orthogonal relation between the two quantities, and the (yellow) shaded region indicates its 68% confidence region, obtained via the IDL code confidence_band. The best fit was obtained via the fitting procedure of Williams et al. (2010). Open (respectively filled) dots indicate clusters whose n(R) has been fit with a pNFW (respectively King) model. A2124 is an outlier on this relation and its [r− 2,g/r200,r-2/r200] point lies off scale at [5.5,0.23].
Current usage metrics show cumulative count of Article Views (full-text article views including HTML views, PDF and ePub downloads, according to the available data) and Abstracts Views on Vision4Press platform.
Data correspond to usage on the plateform after 2015. The current usage metrics is available 48-96 hours after online publication and is updated daily on week days.
Initial download of the metrics may take a while.