Fig. 5
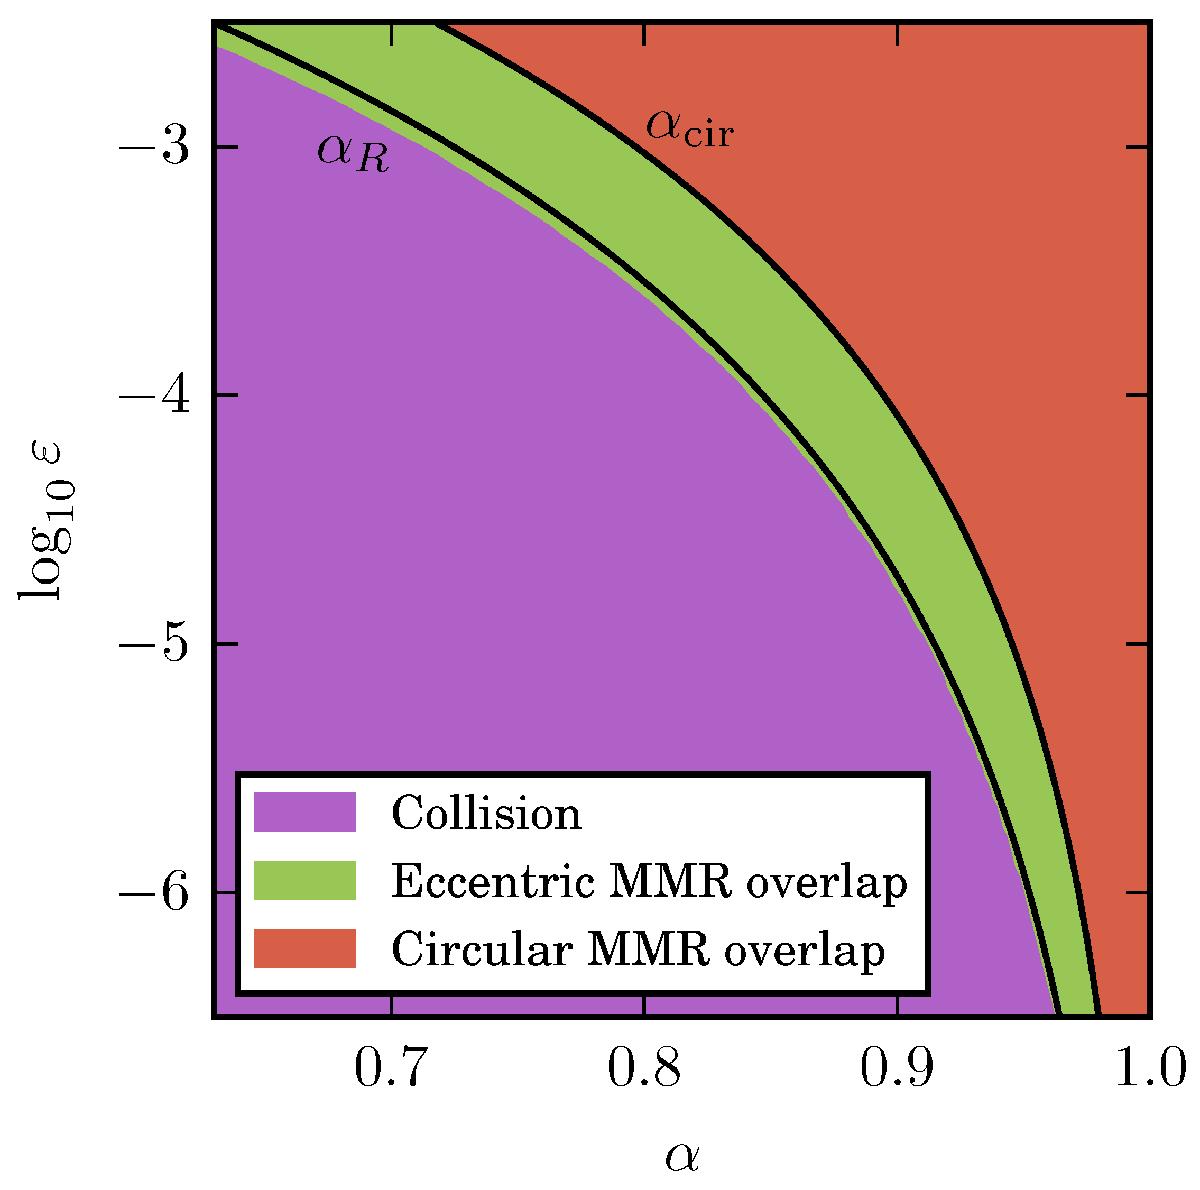
Regions of application of the different criteria presented in this work. The purple region represents ![]() is the smallest, in the green zone,
is the smallest, in the green zone, ![]() is the smallest and the circular overlap criterion is verified in the red zone. We see that the curve αR computed through a development of
is the smallest and the circular overlap criterion is verified in the red zone. We see that the curve αR computed through a development of ![]() and
and ![]() presents a good agreement with the real limit between the green and the purple area. Here γ = 1.
presents a good agreement with the real limit between the green and the purple area. Here γ = 1.
Current usage metrics show cumulative count of Article Views (full-text article views including HTML views, PDF and ePub downloads, according to the available data) and Abstracts Views on Vision4Press platform.
Data correspond to usage on the plateform after 2015. The current usage metrics is available 48-96 hours after online publication and is updated daily on week days.
Initial download of the metrics may take a while.