Fig. 3
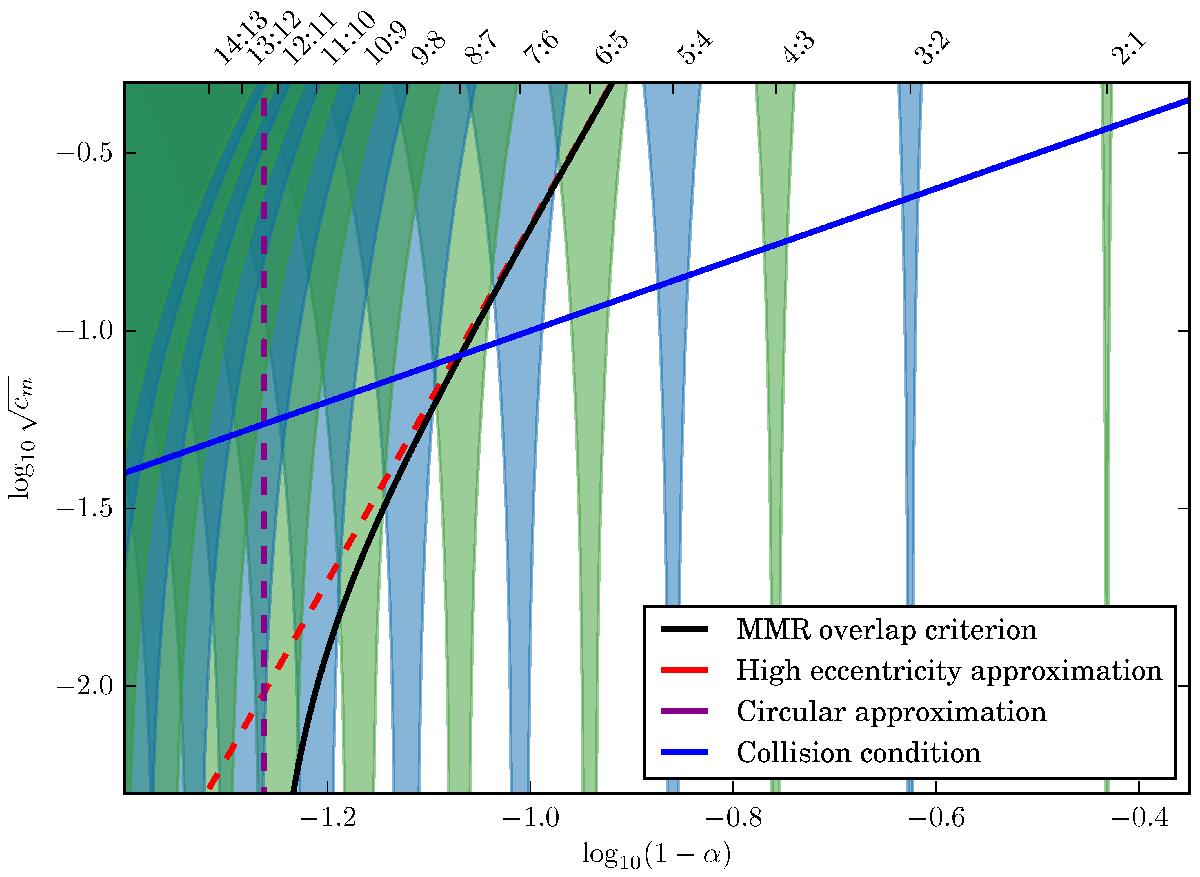
Representation of the MMR overlap criteria. The dotted lines correspond to the criteria proposed by Deck et al. (2013), and the collision curve is the approximation of the collision curve for α → 1. We represented in transparent green (p odd) and blue (p even) the first p:p + 1 MMR islands to show the agreement between the proposed overlap criterion and the actual intersections. In this figure, ε = 10-6.
Current usage metrics show cumulative count of Article Views (full-text article views including HTML views, PDF and ePub downloads, according to the available data) and Abstracts Views on Vision4Press platform.
Data correspond to usage on the plateform after 2015. The current usage metrics is available 48-96 hours after online publication and is updated daily on week days.
Initial download of the metrics may take a while.