Fig. 8
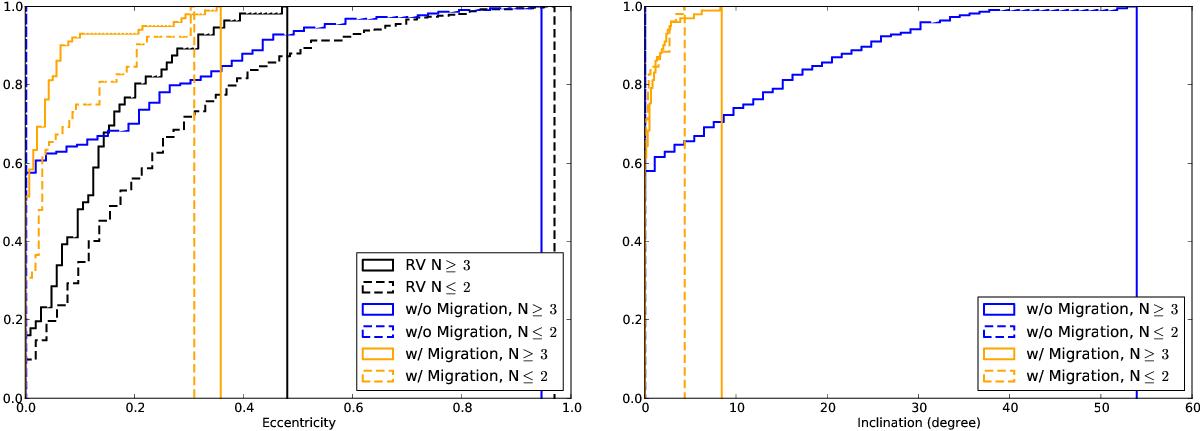
Left: cumulative eccentricity distributions for planets formed in simulations with (orange) and without migration (blue) are compared with distributions of planets detected by the RV method (black). The dashed and solid lines correspond to systems with one or two planets and more than three planets, respectively. Right: corresponding cumulative distributions for inclinations. Simulated planets, in particular those from with-migration runs, tend to have nearly circular and coplanar orbits.
Current usage metrics show cumulative count of Article Views (full-text article views including HTML views, PDF and ePub downloads, according to the available data) and Abstracts Views on Vision4Press platform.
Data correspond to usage on the plateform after 2015. The current usage metrics is available 48-96 hours after online publication and is updated daily on week days.
Initial download of the metrics may take a while.