Fig. 2
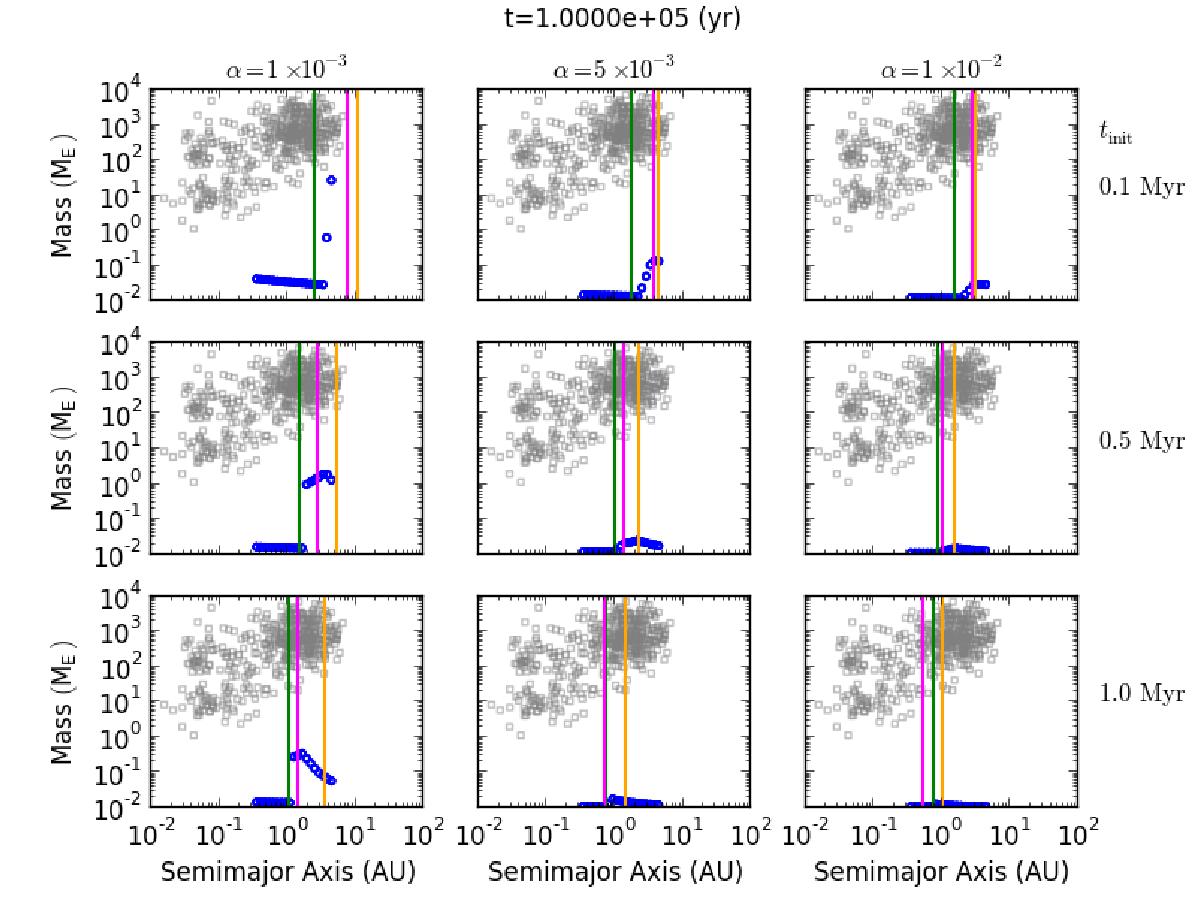
Planetary mass-semimajor axis distribution at the simulation time of 0.1 Myr for a solar metallicity disc with different combinations of a disc’s viscosity parameter α and an initial disc age tinit. Here, tinit = 0.1 and 0.5 Myr correspond to the inital t = 0 and 0.4 Myr, respectively, in Eq. (4). The green, pink, and orange lines indicate the snow line, the boundary between viscous and irradiation regimes, and the boundary between Stokes and Epstein regimes, respectively. Each panel shows the results from five simulations as blue circles, and grey squares represent the corresponding parameters for planets observed by the radial velocity method. A peak and a jump seen in mass growth can be explained by different regimes of the disc (see text).
Current usage metrics show cumulative count of Article Views (full-text article views including HTML views, PDF and ePub downloads, according to the available data) and Abstracts Views on Vision4Press platform.
Data correspond to usage on the plateform after 2015. The current usage metrics is available 48-96 hours after online publication and is updated daily on week days.
Initial download of the metrics may take a while.