Fig. 15
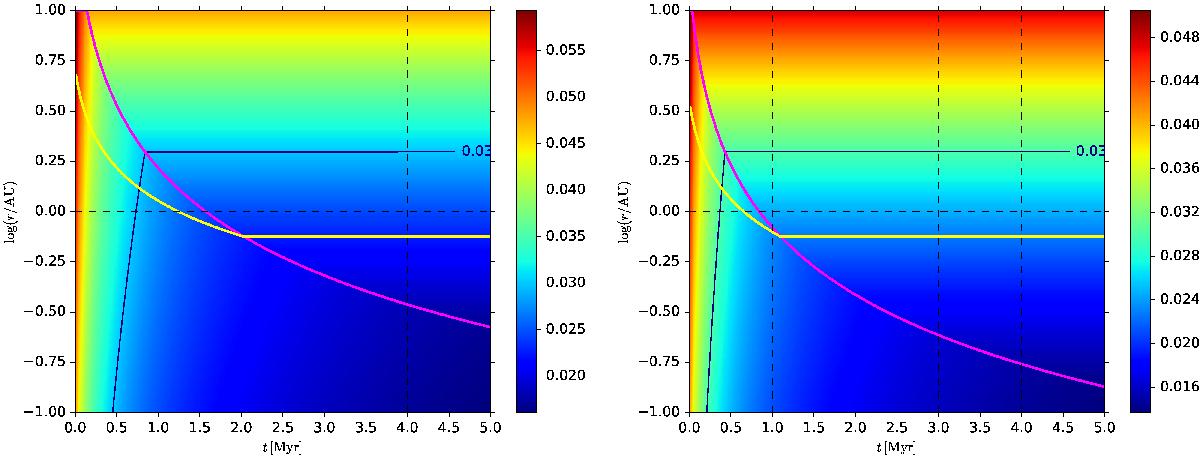
Time evolution of a disc aspect ratio of our disc model with α = 10-3 (left) and 5 × 10⁻³ (right). The black line with 0.03 indicates the critical disc aspect ratio where the pebble isolation mass becomes equal to the critical mass for a rocky planet (see text). The yellow and magenta lines are the snow line and the viscous-irradiative boundary.
Current usage metrics show cumulative count of Article Views (full-text article views including HTML views, PDF and ePub downloads, according to the available data) and Abstracts Views on Vision4Press platform.
Data correspond to usage on the plateform after 2015. The current usage metrics is available 48-96 hours after online publication and is updated daily on week days.
Initial download of the metrics may take a while.