| Issue |
A&A
Volume 607, November 2017
|
|
|---|---|---|
| Article Number | A19 | |
| Number of page(s) | 11 | |
| Section | Planets and planetary systems | |
| DOI | https://doi.org/10.1051/0004-6361/201730954 | |
| Published online | 31 October 2017 | |
Dust-aggregate impact into granular matter: A systematic study of the influence of projectile velocity and size on crater formation and grain ejection
1 CONICET and Facultad de Ciencias Exactas y Naturales, Universidad Nacional de Cuyo, 5500 Mendoza, Argentina
2 Physics Department and Research Center OPTIMAS, University Kaiserslautern, Erwin-Schrödinger-Straße, 67663 Kaiserslautern, Germany
e-mail: This email address is being protected from spambots. You need JavaScript enabled to view it.
Received: 7 April 2017
Accepted: 4 June 2017
Abstract
Context. Dust impact into granular materials leads to crater formation and material ejection.
Aims. The impact of dust aggregates, composed of a number Np of grains, into a granular bed consisting of the same grains is studied as a function of impact velocity v and projectile size Np. No gravitational effects are included.
Methods. Granular-mechanics simulations are used to study the outcome of dust-aggregate impacts. The granular bed and the aggregates are composed of silica grains and have filling factor 0.36.
Results. Both the crater volume and the ejection yield increase sublinearly with total impact energy. No crater rims are formed. Crater shapes change from hemispheric to elongated when increasing either projectile size or velocity. The crater walls are compacted by the impact within a zone of a size comparable to the crater radius. Ejecta are produced at the edges of the impact; only a small fraction of the ejecta stem from the projectile. The energy distribution of the ejecta follows at high energies a 1/E2 decay reminiscent of sputtering from atomic targets. The maximum of the distribution is shifted to higher energies for larger projectiles; this is caused by the increasing depth from which ejected grains originate.
Conclusions. Due to the dissipative nature of intergranular collisions and the porosity of the target, crater morphology and ejecta yield deviate characteristically from impacts into atomic materials.
Key words: planets and satellites: formation / protoplanetary disks / methods: numerical
© ESO, 2017
1. Introduction
Impacts into granular beds may lead to cratering of the surface and eject material. Such impacts are of considerable relevance in an astrophysical context. The surfaces of regolith-covered moons and asteroids are constantly subjected to impacts by dust particles and micro-meteorites, with consequences on the composition and mechanical properties of these surfaces (Schwartz et al. 2014; Speyerer et al. 2016).
This process can also be considered as the extreme case of a very asymmetrical collision in which a small dust aggregate collides with a big one. Such collisions are typical in protoplanetary disks and may occur at high relative velocities, since the large aggregate may already have decoupled from the motion of the gas corotating with the disk (Birnstiel et al. 2016). Impact size and speed then decide on the growth (or erosion) of the collision partners (Blum 2010; Birnstiel et al. 2016).
Collisions into granular beds have been studied experimentally and theoretically by including the relevant stopping forces, the constitutive laws governing the behavior of the granular target and gravity (Uehara et al. 2003; Walsh et al. 2003; Lohse et al. 2004; Pica Ciamarra et al. 2004; Hou et al. 2005; Tsimring & Volfson 2005; Katsuragi & Durian 2007; Katsuragi 2016). Such studies allowed for the attainment of general scaling laws of the cratering process. These investigations are complemented by studies of cratering in (porous) rocks (Melosh 1989, 2011; Güldemeister et al. 2015) and asteroids (Jutzi et al. 2015).
On a microscopic scale, granular-mechanics simulations are able to capture the behavior of individual grains during the impact. Such simulations have been successfully applied to understanding the collision behavior of dust aggregates composed of thousands of grains and to determine the erosion and growth characteristics (Wada et al. 2007; Paszun & Dominik 2009; Wada et al. 2011; Ringl et al. 2012a; Gunkelmann et al. 2016a; Li et al. 2016). This technique was also applied to the process of crater formation in a granular bed (Ringl et al. 2012b; Hurley et al. 2015; Li et al. 2015), albeit only with monomeric, that is, indestructible, projectiles.
A number of simulation studies and experiments were performed on the impact of atomic clusters on atomic targets – for example, metals, but also organic targets – with the aim of exploring the dependence of the crater sizes and sputter yields on the projectile characteristics (Anders et al. 2004; Samela & Nordlund 2008; Anders et al. 2009; Anders & Urbassek 2013; Seah 2013; Seah et al. 2014). In these studies it was found that – above a threshold regime – the main projectile characteristic affecting crater volume and ejection yield is the total projectile energy. This surprisingly simple behavior is in contrast to available knowledge of crater formation in granular targets (Katsuragi 2016).
In the present work, we wish to investigate the cratering process induced by composite projectiles in granular beds for the special case where the projectile is composed of the same grains as the target material. It is assumed that gravity plays no role during and after the impact; in other words, the gravitational interaction among the grains is negligible and the impact occurs in space far from the gravitational influence of other bodies. The granular-mechanics algorithm used is outlined in Sect. 2. By systematically varying projectile size and velocity, we study the crater volumes obtained in Sect. 3, and the ejection process in Sect. 4.
2. Method
2.1. Setup of the system
Both the target and the projectile are composed of silica grains. All grains are spherical with a radius of Rgrain = 0.76μm. Our targets are cubic boxes with a side length of 70.7 μm. They contain about 70 000 grains, and have a filling factor of 36%. They were constructed using the method of Ringl et al. (2012b) by filling grains homogeneously into a box until the required filling factor is reached. The projectile contains a number of Np grains, varying between 1 and 500. This projectile is cut out of the target with approximately spherical shape, and has hence the same porosity as the target.
Initially the projectile is set at a position above the target such that there is no interaction with it. Then the simulation is started by giving each grain in the projectile the same velocity v, which we vary between 5 and 200 m s-1. The top and bottom surfaces of the target are free; at the sides we employ periodic boundary conditions. The time step of the simulation amounts to 50 ps (Ringl & Urbassek 2012); we perform 400 000 time steps in total for each simulation, amounting to 20 μs.
2.2. Granular mechanics algorithm
The details of our simulation method have been published by Ringl & Urbassek (2012). We repeat here the essential details for the convenience of the reader.
The overlap of two grains at distance d is denoted as δ = 2Rgrain−d. The normal force between two grains consists of a repulsive and an attractive contribution. The repulsive part (Pöschel & Schwager 2005), 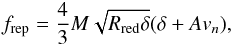 (1)is described by the Hertzian δ3 / 2 law, based on elastic theory, and a dissipative part, describing a viscoelastic contact (Brilliantov et al. 1996). Both interactions vanish for δ< 0. Here Rred = Rgrain/ 2 is the reduced radius, M = Y/ [2(1−ν2)] is the reduced modulus, Y Young’s modulus, ν Poisson’s ratio, vn is the velocity component in normal direction, and A is an empirical factor modeling dissipation. The attractive part of the normal force is taken to be proportional to the specific surface energy γ (Derjaguin et al. 1975; Maugis 2000; Blum 2006) as
  (2)The tangential forces between two grains model the relevant friction forces acting between the two grains. Gliding friction,
 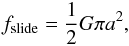 (3)depends on the shear modulus G = Y/ [2(1 + ν)] and the radius
  of the contact area (Burnham & Kulik 1999). Rolling motion is decelerated by a torque (Dominik & Tielens 1997),
 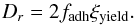 (4)Here, ξyield is the distance that two grains can roll over each other without breaking their atomic contacts. Finally, torsional motion is also decelerated by a torque, whose strength is given by Dominik & Tielens (1997) as
 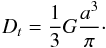 (5)For more details on the calculation of the forces, we refer to Ringl & Urbassek (2012).
The algorithm is implemented in the open-source code LAMMPS (Plimpton 1995). Data analysis and rendering of granular snapshots has been performed using OVITO (Stukowski 2010a).
In our simulations we employ the material parameters for silica; the Young’s modulus is Y = 54 GPa, the Poisson ratio ν = 0.17, and the specific surface energy γ = 25 mJ/m2 (Chokshi et al. 1993). The mass density is taken as ρ = 2 × 10³ kg m-3 (Blum & Schräpler 2004), such that the mass of a grain amounts to m = 3.68 × 10⁻¹⁵ kg. The dissipation constant A = 0.5 ns is obtained from a fit to the experimentally measured (Poppe et al. 2000) coefficient of restitution of silica grains (Ringl & Urbassek 2012). The parameter describing rolling friction, ξyield, is taken to be 1 Å (Dominik & Tielens 1997).
Two energy scales may be used to characterize the strength of intergranular contacts. One of these parameters is the energy needed to break the contact between two spheres; it is given by (Ringl & Urbassek 2012; Ringl et al. 2012a,b)  (6)Here, δequ is the equilibrium distance between two grains in contact and amounts to 3.0 Å for our system. Hence Ebreak = 2.66 × 10⁻¹⁷ J. Another parameter is the so-called rolling energy, that is, the energy needed to roll two spheres through 90° over each other; it amounts to Eroll = 1.1 × 10⁻¹⁶ J (Ringl et al. 2012a).
We considered two sources of systematic calculation errors. (i) For several projectiles, for example, Np = 50 and v = 150 m s-1, we continued our trajectories up to 106 time steps in order to verify whether or not the craters obtained are already final. We observe changes in the crater extensions of less than 8%, and in the volumes of less than 2%; for the ejection yields, there errors are around 5%. (ii) In addition, we created several independent impact trajectories by shifting the projectile impact position slightly on the surface. The changes in the crater extensions are in the range of 3%, in the volumes 4%, and in the ejection yields 15%.
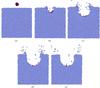 |
Fig. 1 Time series showing the formation of a crater during impact of a Np = 50 projectile at velocity 150 m s-1 (a) before impact and at times of 0.5 (b), 2 (c), 5 (d) and 10 μs (e) after impact. Slices shown are 10 μm thick. Grains are colored to differentiate whether they originate from the projectile or from the target. |
3. Craters
3.1. Analysis of an exemplary case
In this section we analyze a specific case, Np = 50 and v = 150 m s-1, in detail. Figure 1 shows the time evolution of the crater formation process. During this process, the projectile is quickly destroyed, Fig. 1b, while the crater formation takes longer, and is only finished at around 5 μs, Fig. 1d; thereafter only small changes in the crater volume occur, Fig. 1e. During the energetic phase of the crater formation, abundant grain ejection is observed, Fig. 1c; the ejection yield amounts to 291 grains in the present case. Most ejection occurs from the crater side walls and around the crater rim. Most of the ejecta are target grains; only occasionally a projectile grain is ejected.
The process visualized here looks similar to that studied using continuum-mechanics models for crater formation in rocks (Melosh 1989, 2011; Osinski & Pierazzo 2013). In our granular material, it is helpful to consider the impact-induced changes on the number of contacts that each grain experiences; this notion is equivalent to the coordination number used in solid atomic materials. The number of contacts of a grain is calculated by determining the number of adjacent grains with a distance ≤2Rgrain, since for larger distances the intergranular interaction is zero, cf. Sect. 2.2.
 |
Fig. 2 Side view of the target before (a) and at 2 μs (b) and at 10 μs (c) after impact of a Np = 50 projectile at velocity 150 m s-1. Slices shown are 10 μm thick. Grains are colored according to coordination number. |
Before impact the sample shows an average coordination of 2.75; as Fig. 2a shows, fluctuations occur and we find some grains exhibiting four or even five contacts. After impact, the number of contacts increases in a region radially surrounding the crater that is forming. First, at 2 μs after impact, Fig. 2b, this zone is still relatively narrow, but it expands further until the final crater shape has established, Fig. 2c. These figures demonstrate how the impact leads to a localized compaction of the target, showing up as a more highly connected granular network.
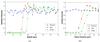 |
Fig. 3 a) Relative density, normalized to the average target density, below the impact crater formed by the impact of a Np = 50 projectile at velocity 150 m s-1, Fig. 1e. Data are taken in a prismatic column with a square cross-section of 10 μm edge length below the center of the impact point. Depth 0 denotes the position of the original surface. b) Relative density for the same event evaluated in spherical shells of 5 μm thickness around the projectile impact point. |
We quantify the compaction occurring in the material by plotting in Fig. 3a the density increase in a column located below the impact point. The data have been normalized to the initial target density. At 2 μs, the crater has already reached a depth of 20 μm; in the crater wall below the impact point a considerable compaction amounting to around 20% has been reached which extends around 10–15 μm in thickness. Below this compaction the material shows no variation with respect to the original material.
The situation has changed again at 20 μs after the impact, where the final crater shape has stabilized (Fig. 1e). The density increase in the crater wall has relaxed to values of around only 10%. However the affected zone now extends deep into the material, down to depths of 60 μm below the original surface. This demonstrates that after the initial crater excavation phase, the final settling of the crater shape is accompanied by considerable relaxation processes in the wider environment of the crater.
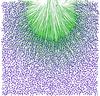 |
Fig. 4 Displacement vector field created by the impact of a Np = 50 projectile at velocity 150 m s-1. The vectors show the grain displacement from their original to their final positions. Final positions are marked by blue dots. Slice shown is 10 μm thick. |
The deformation of the material after impact can be further discussed with the help of the displacement field shown in Fig. 4. Here vectors connect the initial and final positions of each grain in the target. Around the projectile impact point, a radial motion of the material is observed, which is reminiscent of the simple “Z model” of crater formation based on a one-dimensional radial expansion (Melosh 1989). Farther away from the impact point – outside the final crater formed – an exclusively downward motion of the target is observed. This appears to be particular for the porous granular material studied here. In simulations of projectiles impacting atomic solids, a collective motion is also observed; however, it is directed downward only below the impactor, while it is directed upwards around the crater walls leading to pronounced crater rims being formed (Colla et al. 2000). This reversal of motion is natural for high-density solids and also occurs in continuum studies (Melosh 1989), but is prohibited in the porous matter of our simulations, and no crater rims are observed. However, there is grain re-deposition at the surface, leading to increased surface roughness.
The approximate radial symmetry found here can be used to plot the radial dependence of the compaction after impact. To this end we plot in Fig. 3b the density as evaluated in spherical shells of 5 μm thickness around the projectile impact point.
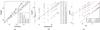 |
Fig. 5 Dependence of the crater volume, V, as a function of a) total impact energy, Etot, b) projectile velocity, v, and c) projectile size, Np. Lines indicate power-law relations to guide the eye, with exponents of a) 1/2 and 2/3, b) 1, and c) 2/3 and 1. |
Due to the larger amount of material contained in these shells the fluctuations are considerably reduced. We see a strong compaction immediately around the temporary crater wall at 2 μs after impact reaching values of 25% above the initial density. This density maximum travels outward with a speed of roughly 1–1.25 m s-1, while it loses intensity. The compaction wave generated by the impact is thus strongly subsonic and does not have the characteristics of a shock wave; general features of such compaction waves have been recently studied for a one-dimensional scenario by Gunkelmann et al. (2016b).
3.2. Crater volume
We calculate the crater volume numerically using a built-in routine in OVITO (Stukowski 2010b); this approximates the crater surface by a polygonal mesh and calculates the crater volume from that (Edelsbrunner & Mücke 1994; Stukowski 2014). The essential parameter of the method is the radius of the probe sphere used to probe the surface, which defines the length scale of the approximation process; it has been set to 3 μm.
The total crater volume V is displayed in Fig. 5a as a function of the total impact energy Etot of the projectile. We observe a clear correlation, which we can render in the form of a power law:  (7)Here ν< 1; we observe ν = 1 / 2 for small projectiles, Np< 100, and ν = 2 / 3 for larger projectiles, and Np ≥ 100. It is noteworthy that our simulations exclude the simple law V ∝ Etot, that is, ν = 1. This simple law was found for cluster impact into atomic solids (Anders et al. 2012a), such as Cu or frozen Ar. We surmise that the highly dissipative nature of collisions in granular targets prohibits a constant fraction of the impact energy being used for crater formation; this results in the sublinear dependence of the crater volume on impact energy found here.
In Figs. 5b and c we plot the dependence of the crater volume on projectile velocity and size, respectively. In both cases, power-law dependencies are observed. The dependence on v shows the same steepening of the exponent as was observed above for μ. Quantitatively, if we set  (8)α increases from 1 to 4/3 with increasing projectile size. The analogous exponent for the Np dependence, however, does not change with velocity and remains equal to β = 2 / 3. However, for larger projectiles and low velocities, β is closer to one, indicating increased efficiency in the cratering process.
Traditionally the dependence of the crater volume on impactor and target properties has been discussed using scaling laws (Schmidt & Housen 1987; Melosh 1989; Holsapple 1993). Impacts are attributed to the so-called strength and gravity regimes according to whether the ratio between gravitational stress – ρgR, where g is the gravitational acceleration – and the yield strength S of the target is smaller or larger than 1. Our simulations cover the strength regime, since we consider gravity to play no role in the impact; actually all impacts of small impactors tend to belong to the strength regime. In this regime, scaling considerations predict for equal properties of projectile and target materials a dependence such as (Katsuragi 2016, Eq. (5.58)) 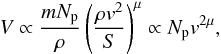 (9)where mNp is the mass of the impactor. Values of μ = 1 (1/2) correspond to the so-called energy (momentum) scaling. Impact experiments in dry sand obtained μ = 0.62 (Schmidt & Housen 1987; Holsapple 1993; Katsuragi 2016). This value is close to that predicted for the momentum-scaling regime; this fact has been rationalized by considering that energy dissipation in granular materials prevents energy conservation, while momentum conservation still holds.
Also, our results, Eq. (8), are closer to the momentum scaling regime, since our α = 2μ assumes values of 1 to 4/3. An exponent β = 1 of the Np dependence, which would correspond to the momentum scaling of Eq. (9), however, shows up only for large and slow projectiles (Fig. 5c). We conclude that our simulation results for dust-aggregate impact cratering do not completely follow the traditional strength-dominated scaling, but require more flexibility.
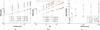 |
Fig. 6 Dependence of the crater depth on the projectile velocity (a) and size (b). Panel c displays the evolution of the crater aspect ratio, d/r, with projectile velocity. Lines indicate power-law relations to guide the eye, with exponents of 1/3 in panelsa and b. |
3.3. Crater morphology
The crater shape – as quantified by its depth, d, and its radius, r, measured at the crater top opening – show a strong dependence on the projectile speed, v, and size, Np. We determine the depth in the final snapshot as the distance of the deepest grain in the crater wall to the original surface. In addition, we determine the diameter of the crater top opening in two orthogonal planes running perpendicular to the surface, and determine r from their average. We demonstrate the v and Np dependencies for the crater depth, d, in Figs. 6a and b. The findings can be approximated by power laws of the form  (10)where the exponent α′ slowly increases from 1/3 for Np< 100 to 4/9 for Np ≥ 100, and β′ remains constant at a value of β′ = 1 / 3. These values correspond quite closely to the momentum-scaling regime seen in Eq. (9), above. We note, however, that the scaling does not fulfill V ∝ d3; while α′ = 3α for the velocity dependence, β′ ≠ 3β. The reason for this lies in the fact that the size of the projectile, Np, influences the crater radius differently from the crater depth.
Indeed, the crater radius, r, shows a slightly different dependence. This is best shown by plotting the crater aspect ratio, d/r (Fig. 6c). While craters formed with small projectiles and/or at low velocities are hemispheric or even shallow (d<r), there is a strong tendency to form deep craters (d>r) for both large and fast projectiles. In our simulations, the largest aspect ratio was around 1.6. In fact the aspect ratio of the exemplary case studied in Sect. 3.1 was d/r = 1.62. We note that for small impact velocities, we studied the crater aspect ratio also for larger impactors (Np = 100–500); the aspect ratio was found not to change further for such large impactor sizes and remained fixed at values of around 0.8 (v = 10 m s-1) and 1.6 (v = 25 m s-1).
Figure 7 gives an example of a hemispheric crater formed for Np = 10, v = 25 m s-1. Here again a compaction zone surrounding the crater walls is established with a width that is of the order of the crater radius, or even slightly larger.
Experimental studies of crater formation in granular beds are usually performed using balls – large indestructible spherical grains – as impactors. The results of such studies are summarized by Katsuragi (2016). An early study (Walsh et al. 2003) reports an  dependence for both crater depth and radius, while another study (Uehara et al. 2003) finds different scalings for radius and depth,
  and
and  , respectively. A later study (de Vet & de Bruyn 2007) finds
  and
and  , in rough agreement with Walsh et al. (2003).
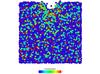 |
Fig. 7 Final state of the crater formed by the impact of a Np = 10 projectile at velocity 25 m s-1, at 20 μs after impact. Grains are colored according to coordination number. The slice shown is 10 μm thick. |
Impact studies on granular beds using granular impactors are more rare. A notable exception is provided by Pacheco-Vázquez & Ruiz-Suárez (2011) who employ velocities large enough to break the impactor during impact. They report that the dependence found for a monolithic impactor (Uehara et al. 2003; Walsh et al. 2003) must be supplemented by a constant summand taking care of horizontal energy transfer during impactor break-up. In contrast, the crater depth remains constant once the impactor breaks up. This behavior is in contrast to the results of our study, where the scaling with impact energy, Eqs. (7) and (10), implies that both d and r increase ∝ with κ< 0.25, and crater depth continues increasing with Etot despite impactor fragmentation. However, we note that our data show that, at small impact energies, the crater radius converges to a finite value, equal to a few grain radii.
We note that all these studies use macroscopic impactors and gravity plays a role during the impact, influencing the scaling (Melosh 1989; Holsapple 1993; Katsuragi 2016), such that these experimental results cannot be immediately compared to our findings. We can thus only conclude that the availability of simple power laws relating crater sizes to impact energy, projectile velocity, and size is a common feature of all cratering studies, even though the exponents vary in the different scenarios studied.
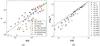 |
Fig. 8 a) Correlation of the sputter yield, Y, with the number of grains emitted from the crater volume, V/ Ω. The line indicates a relation Y = 0.05V/ Ω to guide the eye. b) Same data set as |


Number of clusters containing n grains emitted in two representative impacts.
Studies of crater formation by cluster impact in atomic matter (solid Cu or Ar) show that shallow craters are formed at small impact velocities, which develop into hemispherical craters at high velocities (Anders et al. 2012a); deep craters such as those found here were not observed. We therefore surmise that the feature of deep craters is closely connected to the porous nature of the granular solids studied here, which allow for compaction below the projectile that is not available in compact solids. As mentioned above, Sect. 3.1, the flow pattern of the material after impact is also downward directed for granular matter – strongly different from impact into compact atomic solids – and thus allows for downward elongation of the crater shapes.
We note that the volume obtained by the polynomial mesh algorithm used here (Stukowski 2010b) agrees well with the ellipsoidal approximation, V = (2π/ 3)r2d, with the exception of small craters that may be quite irregular.
In a previous study (Ringl et al. 2012b), a crater formed by impact of a single grain on a granular bed similar to ours – but simulated for granular beds with various porosities – was studied; however, the impactor was three times the size (and 27 times the mass) of the grains constituting the target. There, more irregularly shaped (tubelike, conical or “carrot-like”) craters were obtained, in particular for highly porous targets, that were reminiscent of craters found during the STARDUST mission (Iida et al. 2010). For granular targets with porosities increasing to our values, the craters assumed an aspect ratio of d/r = 1.2 for impact velocities of 10–30 m s-1; these values are in the range of our data for small projectiles (Fig. 6c).
4. Ejecta
4.1. Yields
While during crater formation the major part of the material is pressed into the crater walls, compacting the wall material, part of the crater volume is emitted into the vacuum above the surface. We determine the ejection yield, Y, that is, the number of ejected grains per impact, by counting all grains that have been removed by at least 3.5 μm above the original surface. The choice of this height is somewhat arbitrary; it was taken as a compromise to guarantee that all ejecta that have reached this height will not collide with other grains or the crater rim and be reflected back to the surface, and that even slow grains will have escaped past this height until the end of the simulation. We verified that a slightly smaller value, or any larger value, would not change the final count of ejecta by more than around 5% (we refer to Sect. 2.2).
In their experimental work, Deboeuf et al. (2009) assume that the crater volume is directly given by the corresponding volume of ejected particles. This is not always the case, however, at the nanoscale (Bringa et al. 2002), and might not be the case for granular impacts. In order to correlate the ejection yield with the excavated crater volume, we divide the measured crater volume, V, by the average volume of a grain in the target (obtained by dividing the target volume by the number of grains), Ω = 5.11μm3; this gives us the effective number of grains that have been excavated from the crater volume. Figure 8a shows that in all cases, Y is less than approximately 10% of the grains removed from the crater; and these high fractions are only reached for small projectile sizes, Np ≤ 10. For larger projectiles the ejection process is even less efficient, such that only <1% of the grains removed from the crater show up as ejecta. Figure 8a demonstrates the trend that with increasing crater volume also the fraction of ejected grains increases.
We also note that the ejecta are constituted mainly of target material, in particular for the larger projectiles. For instance in the case of impacts with a velocity of 100 m s-1, for Np ≥ 20, there is, at most, one projectile grain reflected from the target, while the total ejection yield is Y> 100. For smaller impactors, the situation changes somewhat; thus there are three reflected grains for Np = 5 (Y = 69), and for Np = 1 the projectile grain is reflected while no target grain joins it.
In general we find that the ejecta exist mainly as monomers; only a few dimers and larger clusters are ejected. Table 1 gives representative examples for a small, fast projectile and a large, slow projectile. In both cases, tetramers are the largest clusters, with the exception of one emitted heptamer. The ejection of larger clusters is prevented by the smallness of the attractive forces between the grains.
Anders et al. (2012a) showed that during emission from atomic solids, around one third to one tenth of the crater volume is ejected into the vacuum above the solid; the fraction decreases with increasing projectile size. These values are considerably higher than the values found here. The reason for the stronger contribution of ejection to crater excavation for compact atomic solids lies in the fact that compaction of the target material is hardly possible in this case, leaving ejection – besides uplift of crater material onto the surface, that is, rim formation – as the main channel for crater excavation. In atomic solids, melt flow can also contribute significantly to crater excavation (Anders et al. 2012b), and this is also prevented in granular materials.
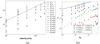 |
Fig. 9 Ejection yields, Y, as a function of projectile velocity (a) and projectile size (b). The black lines indicate power-law dependencies, Y ∝ v in panel a, and |

Figure 9 shows the dependence of the ejecta yield, Y, on impact velocity and size. Again, we can use a power law to describe our data,  (11)Our simulation results are well described by ϵ = 1 and ζ = 1 / 3 throughout the parameter space investigated in this study. We note that a Y ∝ v dependence has also been found previously for impacts of single grains (“balls’) into granular beds (Ringl et al. 2012b). Figure 9b shows that velocities below approximately 25 m s-1 ensure target growth despite ejection, due to accretion of the projectile, for Np larger than around 10.
The scaling of the yield, Eq. (11), differs somewhat from that of the volume, Eq. (8). While the velocity dependence is similar, α ≈ ϵ = 1, the projectile-size dependence is different (β = 2 / 3, while ζ = 1 / 3). This different scaling results in the scatter of the Y(V) correlation displayed in Fig. 8a. We can decrease the scatter somewhat by eliminating the velocity dependence from Eqs. (8) and (11), assuming α = 1; this suggests that 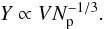 (12)Figure 8b shows that this relation is justified for large craters, V> 2000Ω, where the constant of proportionality in Eq. (12) is 0.2. Deviations are observed for smaller velocities, where only small craters are produced, and are particularly pronounced for large projectiles, since here the projectile shields the crater center from emitting matter. This is in contrast with the macroscopic impacts studied by Deboeuf et al. (2009), where it was concluded that impactor size does not affect ejection scaling.
This behavior is in gross contrast to the sputter yield induced by atomic clusters on atomic targets. There, the sputter yield is proportional to the total impact energy, above a threshold energy, as has been reported first for Lennard-Jones bonded solids (Anders et al. 2004), but later also for metal targets (Anders et al. 2009; Anders & Urbassek 2013) and organic materials (Seah 2013; Seah et al. 2014). The physical picture behind this simple dependence is that the projectile energy is deposited close to the target surface and is hence available for inducing sputtering. This is different from the bombardment of granular targets since here dissipation is strong and hence not all the impact energy – or at least not a constant, Np and v independent fraction – is available for ejection.
 |
Fig. 10 Distribution of a) energy and b) depth of origin of grains ejected from the target for various projectiles. Lines in panel a indicate fits to Eq. (13) (see text). |
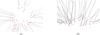 |
Fig. 11 Trajectories of the grains ejected from the target by the impact of a Np = 50 projectile at velocity 150 m s-1. a) top view, b) side view. The initial grain positions of ejecta are marked by dots; all non-ejected grains are omitted. Bends in the trajectories are caused by collisions with other grains. |
4.2. Energy distributions
In Fig. 10a we display the energy distributions of ejecta for several representative cases. In these cases, in order to enhance the statistical significance of our data set, we performed up to five impacts for a given projectile size and velocity. The distributions feature a broad maximum at an energy, Emax, in the range of (1−10) × 10-15 J.
An astonishing characteristic of the energy distribution of the ejecta is their slow fall-off at high velocities, which follows a power-law, ∝E-2, with ejecta energy E. Such power-law distributions are well-known in the field of sputtering of solids by energetic particle impact, and are the signature of linear collision cascades (Sigmund 1981). In these cascades, the impacting projectile shares its energy with a target atom, which consequently recoils from its lattice site; both the deflected projectile and the recoil then continue colliding with other atoms, and so on, thus establishing a collision cascade. The energy sharing in this cascade can be shown to lead to a 1 /E2 distribution of recoil atoms (Thompson 1968; Sigmund 1981). When particles are emitted from the surface, they lose the surface binding energy, U, and the energy distribution of sputtered atoms is given by  (13)with a maximum at Emax = U/ 2.
We fitted our energy distributions to this law, Eq. (13), in Fig. 10a; the fits describe the data surprisingly well. We interpret this agreement as a sign that also the stopping of granular clusters leads to the generation of collision cascades among the target grains by which the incident energy is distributed to neighboring grains; near-surface grains which have received an outward-directed momentum may then be ejected.
The values of U obtained in the fit process amount to 1.4 × 10⁻¹⁵ J (v = 25 m s-1, Np = 50) and 2.0 × 10⁻¹⁵ J (v = 25 m s-1, Np = 150) for the low-velocity impacts and 8.0 × 10⁻¹⁵ J for the high-velocity impact (v = 150 m s-1, Np = 50). Such a dependence on the impact conditions is not observed for sputtering of atomic solids, where U is a constant, depending only on the target material but not on the projectile species or energy. For our granular material, a first idea might be to assume that the surface-binding energy equals the break-up energy, Ebreak, multiplied by the average number of contacts in the material, Nc,  (14)Since Nc = 2.75 (Sect. 3.1) and Ebreak = 2.8 × 10⁻¹⁷ J, the estimate Eq. (14) predicts U = 7.7 × 10⁻¹⁷ J, which is one to two orders of magnitude too small. A similar estimate based on the rolling energy, Eroll, gives U = 2 × 10-16 J, which is again too small. This demonstrates that – in contrast to atomic solids – the energy loss of ejected grains does not occur only on the last step of emission from the surface, but is rather connected to the energy dissipation during the entire chain of collisions to which the ejected grain is subjected before emission. Indeed, it was shown previously by means of transport theory and Monte Carlo simulations (Urbassek et al. 1995) that the energy distribution in an atomic collision cascade changes if recoiling particles lose energy inside the material; the energy spectrum at low energies is flattened in a similar way as would be the case for a “surface binding energy”.
The apparent increase in the fitted values of U (Fig. 10a) can be related to the increase in the depth of origin of the ejecta. We display in Fig. 10b the distribution of the depths of origin of ejected grains. The average depth increases from 1.10 ± 0.07μm in the case of the low-velocity impact (v = 25 m s-1, Np = 50) to 1.53 ± 0.05μm for the high-velocity impact (v = 150 m s-1, Np = 50). This increased depth of origin will lead to an increased number of contacts, which need to be broken during emission, and hence a higher apparent value of U.
We illustrate the collisions that ejected grains suffered before final ejection in Fig. 11, which displays the trajectories of the ejecta for the specific case discussed in detail in Sect. 3.1; both a top and a side view are provided. The ejecta originate from an annular region surrounding the projectile impact point. We note that most ejecta suffered collisions after they first started as recoils to be ejected, as becomes particularly evident from the side view. During these collisions, ejecta may lose a considerable part of their initial kinetic energy.
The results obtained here on the ejection process generalize previous findings of Ringl et al. (2012b) on the impact of a monatomic projectile, v = 30 m s-1, on a granular bed. Also there, power-law-like energy distributions of the ejecta were obtained with an apparent value of U = 1.4 × 10⁻¹⁵ J, close to the value for small projectiles found here. Our present findings show that U increases with projectile size and speed.
Experiments on the properties of ejecta produced during impacts on granular targets are rare (Katsuragi 2016). One exception is the work of Deboeuf et al. (2009) who shot steel spheres into beds formed of glass beads and determined the average energy of ejecta, Eav, from the motion of the ejected beads. They found a scaling  . Another, similar experiment (Marston et al. 2012) observed a different exponent in this relation, such that Katsuragi (2016) concludes that the experimental situation is confusing. We note, however, that the experimentally observed increase of Eav with Etot is in line with our finding that the maximum of the energy distribution, Emax = U/ 2, increases with projectile velocity and size.
Another series of experiments have been performed by Beladjine et al. (2007) and Ammi et al. (2009) who studied the splash process – the grain ejection caused by oblique impact of a single grain on a granular bed, basic for sand movement in dunes – using mm-sized polymer beads impacting with velocities in the range of 10–40 m s-1; the results were analyzed by numerical simulations (Crassous et al. 2007; Tanabe et al. 2017). In these experiments, gravity is relevant; hence the ejecta velocity is measured at a distance of one grain diameter above the original target surface. It was found that the vertical velocity component of the ejecta does not follow a power law as in our case (Eq. (13)) but instead a lognormal distribution. Crassous et al. (2007) argue that the splash emission is caused by collision chains, analogous to force bridges supported by neighboring grains; however, such a scenario is unlikely to work in our case of perpendicular impact. Tanabe et al. (2017) found that ejecta carry only approximately 10% of the impact energy, and Deboeuf et al. (2009) found a fraction of 3% for larger projectiles. Our simulations display much smaller fractions of the energy going into the energy of the ejecta. For instance, for the case in Fig. 1, the fraction is only 0.3%. This reduction might be due to the break-up of the projectile and also to the larger friction between μm-sized grains than between macroscopic grains.
5. Summary
Impacts of granular clusters on a granular target are studied with the help of granular-mechanics simulations. By performing an extensive set of simulations we investigate the dependence of crater formation and grain ejection on projectile speed and size. It is assumed that gravity plays no role during the impact and crater formation. We find the following results on crater formation by dust-aggregate clusters.
-
1.
For small cluster sizes and velocities, the crater hasapproximately hemispherical shape. Its depth increases inrelation to its width with increasing size and velocity.
-
2.
The total crater volume increases sublinearly with the total impact energy. This is in contrast to craters in atomic targets.
-
3.
Material processes in the irradiated granular target are characterized by an overall downward motion of the porous target inducing a compaction in the vicinity of the crater walls and an increase of the number of contacts of the grains. There is no rim formation.
-
4.
While the scaling of the crater depth follows quite closely that predicted by the so-called momentum-scaling of the strength-dominated cratering regime, this scaling is not followed so clearly for the crater volume. The reason is that crater morphology changes with impactor size and speed.
As a rule, crater formation is accompanied by grain ejection. We find the following systematics.
-
5.
Ejecta yields amount to ≤10% of the grains excavated from the crater; the majority of grains are compacted into the crater walls. The fraction of ejected grains increases with projectile size and speed.
-
6.
Also ejection yields scale sublinearly with impact energy, again in strong contrast to cluster-induced sputtering from atomic targets.
-
7.
Ejecta have energy distributions characterized by a power-law decay ∝E-2 at high ejection energies E; this is analogous to sputtered-particle distributions from atomic targets.
-
8.
The depth of origin of ejecta and the number of collisions they suffer before emission increases with projectile size and speed. Concomitantly the energy distribution of emitted ejecta shifts to higher energies.
-
9.
Impact velocities below approximately 25 m s-1 ensure target growth despite ejection, due to accretion of the projectile, for Np larger than around 10.
In summary, our study shows that cratering of granular targets exhibits strong differences to cratering of atomic targets. Both the dissipative nature of grain collisions and the porous nature of the target contribute to this difference.
In the future, impacts of larger projectiles, requiring much larger targets, should be investigated. Such impacts might display shielding effects leading to crater volumes further deviating from simple linear scaling with incoming energy. In addition, targets and projectiles might consist of poly-disperse grain sizes; the investigation of such collisions might show enhanced friction loss, and larger changes in the cratering and ejection process, such as those recently described for aggregate collisions with a bimodal grain-size distribution (Gunkelmann et al. 2017).
Acknowledgments
We thank Christian Ringl and Nina Gunkelmann for help with the setup of the simulation target and for discussions. E.M. and E.M.B. thank for support from SeCTyP-UNCuyo grant 2016-M003, and ANPCyT grant PICT-2014-0696.
References
- Ammi, M., Oger, L., Beladjine, D., & Valance, A. 2009, Phys. Rev. E, 79, 021305 [CrossRef] [Google Scholar]
- Anders, C., & Urbassek, H. M. 2013, Nucl. Instr. Meth. B, 303, 200 [Google Scholar]
- Anders, C., Urbassek, H. M., & Johnson, R. E. 2004, Phys. Rev. B, 70, 155404 [CrossRef] [Google Scholar]
- Anders, C., Ziegenhain, G., Zimmermann, S., & Urbassek, H. M. 2009, Nucl. Instr. Meth. B, 267, 3122 [NASA ADS] [CrossRef] [Google Scholar]
- Anders, C., Bringa, E. M., Fioretti, F. D., Ziegenhain, G., & Urbassek, H. M. 2012a, Phys. Rev. B, 85, 235440 [NASA ADS] [CrossRef] [Google Scholar]
- Anders, C., Ziegenhain, G., Ruestes, C. J., Bringa, E. M., & Urbassek, H. M. 2012b, New J. Phys., 14, 083016 [NASA ADS] [CrossRef] [Google Scholar]
- Beladjine, D., Ammi, M., Oger, L., & Valance, A. 2007, Phys. Rev. E, 75, 061305 [NASA ADS] [CrossRef] [Google Scholar]
- Birnstiel, T., Fang, M., & Johansen, A. 2016, Space Sci. Rev., 205, 41 [NASA ADS] [CrossRef] [Google Scholar]
- Blum, J. 2006, Adv. Phys., 55, 881 [NASA ADS] [CrossRef] [Google Scholar]
- Blum, J. 2010, Res. Astron. Astrophys., 10, 1199 [NASA ADS] [CrossRef] [Google Scholar]
- Blum, J., & Schräpler, R. 2004, Phys. Rev. Lett., 93, 115503 [NASA ADS] [CrossRef] [PubMed] [Google Scholar]
- Brilliantov, N. V., Spahn, F., Hertzsch, J.-M., & Pöschel, T. 1996, Phys. Rev. E, 53, 5382 [Google Scholar]
- Bringa, E. M., Johnson, R. E., & Papaleo, R. 2002, Phys. Rev. B, 65, 094113 [NASA ADS] [CrossRef] [Google Scholar]
- Burnham, N., & Kulik, A. A. 1999, in Handbook of Micro/Nano Tribology, 2nd edn., ed. B. Bhushan (Boca Raton: CRC Press), 247 [Google Scholar]
- Chokshi, A., Tielens, A. G. G. M., & Hollenbach, D. 1993, ApJ, 407, 806 [Google Scholar]
- Colla, T. J., Aderjan, R., Kissel, R., & Urbassek, H. M. 2000, Phys. Rev. B, 62, 8487 [NASA ADS] [CrossRef] [Google Scholar]
- Crassous, J., Beladjine, D., & Valance, A. 2007, Phys. Rev. Lett., 99, 248001 [NASA ADS] [CrossRef] [PubMed] [Google Scholar]
- Deboeuf, S., Gondret, P., & Rabaud, M. 2009, Phys. Rev. E, 79, 041306 [NASA ADS] [CrossRef] [Google Scholar]
- Derjaguin, B. V., Muller, V. M., & Toporov, Y. P. 1975, J. Colloid Interface Sci., 53, 314 [Google Scholar]
- de Vet, S. J., & de Bruyn, J. R. 2007, Phys. Rev. E, 76, 041306 [NASA ADS] [CrossRef] [Google Scholar]
- Dominik, C., & Tielens, A. G. G. M. 1997, ApJ, 480, 647 [NASA ADS] [CrossRef] [Google Scholar]
- Edelsbrunner, H., & Mücke, E. P. 1994, ACM Trans. Graphic, 13, 43 [Google Scholar]
- Güldemeister, N., Wünnemann, K., & Poelchau, M. H. 2015, in Large Meteorite Impacts and Planetary Evolution V, eds. G. R. Osinski, & D. A. Kring (The Geological Society of America), Geological Society of America Special Papers, 518, 17 [Google Scholar]
- Gunkelmann, N., Ringl, C., & Urbassek, H. M. 2016a, A&A, 589, A30 [NASA ADS] [CrossRef] [EDP Sciences] [Google Scholar]
- Gunkelmann, N., Ringl, C., & Urbassek, H. M. 2016b, Comp. Part. Mech., 3, 429 [CrossRef] [Google Scholar]
- Gunkelmann, N., Kataoka, A., Dullemond, C. P., & Urbassek, H. M. 2017, A&A, 599, L4 [NASA ADS] [CrossRef] [EDP Sciences] [Google Scholar]
- Holsapple, K. A. 1993, Annu. Rev. Earth Planet. Sci., 21, 333 [CrossRef] [Google Scholar]
- Hou, M., Peng, Z., Liu, R., Lu, K., & Chan, C. K. 2005, Phys. Rev. E, 72, 062301 [NASA ADS] [CrossRef] [Google Scholar]
- Hurley, R. C., Lim, K.-W., & Andrade, J. E. 2015, in Rapid Penetration into Granular Media, eds. M. Iskander, S. Bless, & M. Omidvar (Oxford: Elsevier), 291 [Google Scholar]
- Iida, Y., Tsuchiyama, A., Kadono, T., et al. 2010, Meteorit. Planet. Sci., 45, 1302 [NASA ADS] [CrossRef] [Google Scholar]
- Jutzi, M., Holsapple, K., Wünneman, K., & Michel, P. 2015, in Asteroids IV, eds. P. Michel, F. E. DeMeo, & W. F. Bottke Jr. (University of Arizona Press), 679 [Google Scholar]
- Katsuragi, H. 2016, Physics of soft impact and cratering, Lecture Notes in Physics, Vol. 910 (Springer) [Google Scholar]
- Katsuragi, H., & Durian, D. J. 2007, Nature Phys., 3, 420 [NASA ADS] [CrossRef] [Google Scholar]
- Li, Z., Guo, Q., Li, Z., et al. 2015, Nano Lett., 15, 8077 [NASA ADS] [CrossRef] [Google Scholar]
- Li, Y., Dove, A., Curtis, J. S., & Colwell, J. E. 2016, Powder Technol., 288, 303 [CrossRef] [Google Scholar]
- Lohse, D., Bergmann, R., Mikkelsen, R., et al. 2004, Phys. Rev. Lett., 93, 198003 [NASA ADS] [CrossRef] [Google Scholar]
- Marston, J., Li, E., & Thoroddsen, S. 2012, J. Fluid Mech., 704, 5 [NASA ADS] [CrossRef] [Google Scholar]
- Maugis, D. 2000, Contact, adhesion and rupture of elastic solids (Berlin: Springer) [Google Scholar]
- Melosh, H. J. 1989, Impact Cratering: A geologic process (New York: Oxford UP) [Google Scholar]
- Melosh, H. J. 2011, Planetary Surface Processes (Cambridge: Cambridge University Press) [Google Scholar]
- Osinski, G. R., & Pierazzo, E. 2013, Impact Cratering: Processes and Products (Wiley-Blackwell) [Google Scholar]
- Pacheco-Vázquez, F., & Ruiz-Suárez, J. C. 2011, Phys. Rev. Lett., 107, 218001 [NASA ADS] [CrossRef] [Google Scholar]
- Paszun, D., & Dominik, C. 2009, A&A, 507, 1023 [NASA ADS] [CrossRef] [EDP Sciences] [Google Scholar]
- PicaCiamarra, M., Lara, A. H., Lee, A. T., et al. 2004, Phys. Rev. Lett., 92, 194301 [NASA ADS] [CrossRef] [PubMed] [Google Scholar]
- Plimpton, S. 1995, J. Comput. Phys., 117, 1 [Google Scholar]
- Poppe, T., Blum, J., & Henning, T. 2000, ApJ, 533, 454 [NASA ADS] [CrossRef] [Google Scholar]
- Pöschel, T., & Schwager, T. 2005, Computational granular dynamics: models and algorithms (Springer) [Google Scholar]
- Ringl, C., & Urbassek, H. M. 2012, Comput. Phys. Commun., 183, 986 [NASA ADS] [CrossRef] [Google Scholar]
- Ringl, C., Bringa, E. M., Bertoldi, D. S., & Urbassek, H. M. 2012a, ApJ, 752, 151 [NASA ADS] [CrossRef] [Google Scholar]
- Ringl, C., Bringa, E. M., & Urbassek, H. M. 2012b, Phys. Rev. E, 86, 061313 [NASA ADS] [CrossRef] [Google Scholar]
- Samela, J., & Nordlund, K. 2008, Phys. Rev. Lett., 101, 027601 [NASA ADS] [CrossRef] [PubMed] [Google Scholar]
- Schmidt, R., & Housen, K. 1987, Int. J. Impact Eng., 5, 543 [NASA ADS] [CrossRef] [Google Scholar]
- Schwartz, S. R., Michel, P., Richardson, D. C., & Yano, H. 2014, Planet. Space Sci., 103, 174 [NASA ADS] [CrossRef] [Google Scholar]
- Seah, M. P. 2013, J. Phys. Chem. C, 117, 12622 [CrossRef] [Google Scholar]
- Seah, M. P., Havelund, R., & Gilmore, I. S. 2014, J. Phys. Chem. C, 118, 12862 [CrossRef] [Google Scholar]
- Sigmund, P. 1981, in Sputtering by particle bombardment I, ed. R. Behrisch (Berlin: Springer), 9 [Google Scholar]
- Speyerer, E. J., Povilaitis, R. Z., Robinson, M. S., Thomas, P. C., & Wagner, R. V. 2016, Nature, 538, 215 [NASA ADS] [CrossRef] [Google Scholar]
- Stukowski, A. 2010a, Model. Simul. Mater. Sci. Eng., 18, 015012 , http://www.ovito.org/ [Google Scholar]
- Stukowski, A. 2010b, https://www.ovito.org/manual/ [Google Scholar]
- Stukowski, A. 2014, JOM, 66, 399 [CrossRef] [Google Scholar]
- Tanabe, T., Shimada, T., Ito, N., & Nishimori, H. 2017, Phys. Rev. E, 95, 022906 [NASA ADS] [CrossRef] [Google Scholar]
- Thompson, M. W. 1968, Philos. Mag., 18, 377 [NASA ADS] [CrossRef] [Google Scholar]
- Tsimring, L. S., & Volfson, D. 2005, in Powders and Grains 2005, eds. R. Garcia-Rojo, H. J. Herrmann, & S. McNamara (Rotterdam: A. A. Balkema), 1215 [Google Scholar]
- Uehara, J. S., Ambroso, M. A., Ojha, R. P., & Durian, D. J. 2003, Phys. Rev. Lett., 90, 194301; Erratum: 91, 149902 [NASA ADS] [CrossRef] [PubMed] [Google Scholar]
- Urbassek, H. M., Mayer, G., Gades, H., & Vicanek, M. 1995, Nucl. Instr. Meth. B, 103, 275 [NASA ADS] [CrossRef] [Google Scholar]
- Wada, K., Tanaka, H., Suyama, T., Kimura, H., & Yamamoto, T. 2007, ApJ, 661, 320 [NASA ADS] [CrossRef] [Google Scholar]
- Wada, K., Tanaka, H., Suyama, T., Kimura, H., & Yamamoto, T. 2011, ApJ, 737, 36 [NASA ADS] [CrossRef] [Google Scholar]
- Walsh, A. M., Holloway, K. E., Habdas, P., & de Bruyn, J. R. 2003, Phys. Rev. Lett., 91, 104301 [NASA ADS] [CrossRef] [PubMed] [Google Scholar]
All Tables
All Figures
|
Fig. 1 Time series showing the formation of a crater during impact of a Np = 50 projectile at velocity 150 m s-1 (a) before impact and at times of 0.5 (b), 2 (c), 5 (d) and 10 μs (e) after impact. Slices shown are 10 μm thick. Grains are colored to differentiate whether they originate from the projectile or from the target. |
| In the text | |
|
Fig. 2 Side view of the target before (a) and at 2 μs (b) and at 10 μs (c) after impact of a Np = 50 projectile at velocity 150 m s-1. Slices shown are 10 μm thick. Grains are colored according to coordination number. |
| In the text | |
|
Fig. 3 a) Relative density, normalized to the average target density, below the impact crater formed by the impact of a Np = 50 projectile at velocity 150 m s-1, Fig. 1e. Data are taken in a prismatic column with a square cross-section of 10 μm edge length below the center of the impact point. Depth 0 denotes the position of the original surface. b) Relative density for the same event evaluated in spherical shells of 5 μm thickness around the projectile impact point. |
| In the text | |
|
Fig. 4 Displacement vector field created by the impact of a Np = 50 projectile at velocity 150 m s-1. The vectors show the grain displacement from their original to their final positions. Final positions are marked by blue dots. Slice shown is 10 μm thick. |
| In the text | |
|
Fig. 5 Dependence of the crater volume, V, as a function of a) total impact energy, Etot, b) projectile velocity, v, and c) projectile size, Np. Lines indicate power-law relations to guide the eye, with exponents of a) 1/2 and 2/3, b) 1, and c) 2/3 and 1. |
| In the text | |
|
Fig. 6 Dependence of the crater depth on the projectile velocity (a) and size (b). Panel c displays the evolution of the crater aspect ratio, d/r, with projectile velocity. Lines indicate power-law relations to guide the eye, with exponents of 1/3 in panelsa and b. |
| In the text | |
|
Fig. 7 Final state of the crater formed by the impact of a Np = 10 projectile at velocity 25 m s-1, at 20 μs after impact. Grains are colored according to coordination number. The slice shown is 10 μm thick. |
| In the text | |
|
Fig. 8 a) Correlation of the sputter yield, Y, with the number of grains emitted from the crater volume, V/ Ω. The line indicates a relation Y = 0.05V/ Ω to guide the eye. b) Same data set as |
| In the text | |
|
Fig. 9 Ejection yields, Y, as a function of projectile velocity (a) and projectile size (b). The black lines indicate power-law dependencies, Y ∝ v in panel a, and |
| In the text | |
|
Fig. 10 Distribution of a) energy and b) depth of origin of grains ejected from the target for various projectiles. Lines in panel a indicate fits to Eq. (13) (see text). |
| In the text | |
|
Fig. 11 Trajectories of the grains ejected from the target by the impact of a Np = 50 projectile at velocity 150 m s-1. a) top view, b) side view. The initial grain positions of ejecta are marked by dots; all non-ejected grains are omitted. Bends in the trajectories are caused by collisions with other grains. |
| In the text | |
Current usage metrics show cumulative count of Article Views (full-text article views including HTML views, PDF and ePub downloads, according to the available data) and Abstracts Views on Vision4Press platform.
Data correspond to usage on the plateform after 2015. The current usage metrics is available 48-96 hours after online publication and is updated daily on week days.
Initial download of the metrics may take a while.