Free Access
Fig. 1
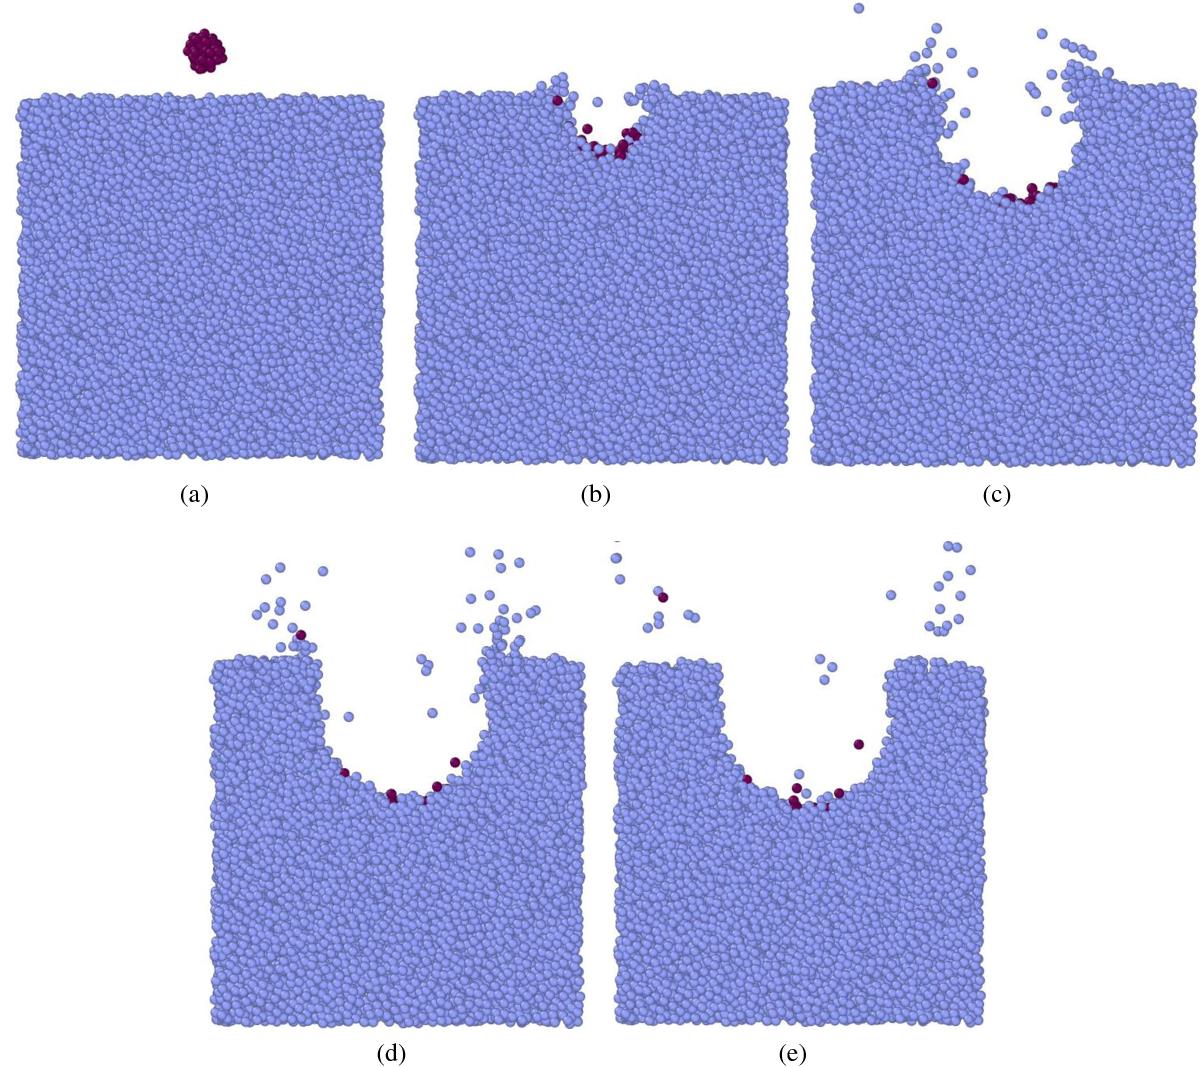
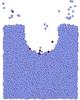
Time series showing the formation of a crater during impact of a Np = 50 projectile at velocity 150 m s-1 (a) before impact and at times of 0.5 (b), 2 (c), 5 (d) and 10 μs (e) after impact. Slices shown are 10 μm thick. Grains are colored to differentiate whether they originate from the projectile or from the target.
This figure is made of several images, please see below:

Current usage metrics show cumulative count of Article Views (full-text article views including HTML views, PDF and ePub downloads, according to the available data) and Abstracts Views on Vision4Press platform.
Data correspond to usage on the plateform after 2015. The current usage metrics is available 48-96 hours after online publication and is updated daily on week days.
Initial download of the metrics may take a while.