Fig. 2
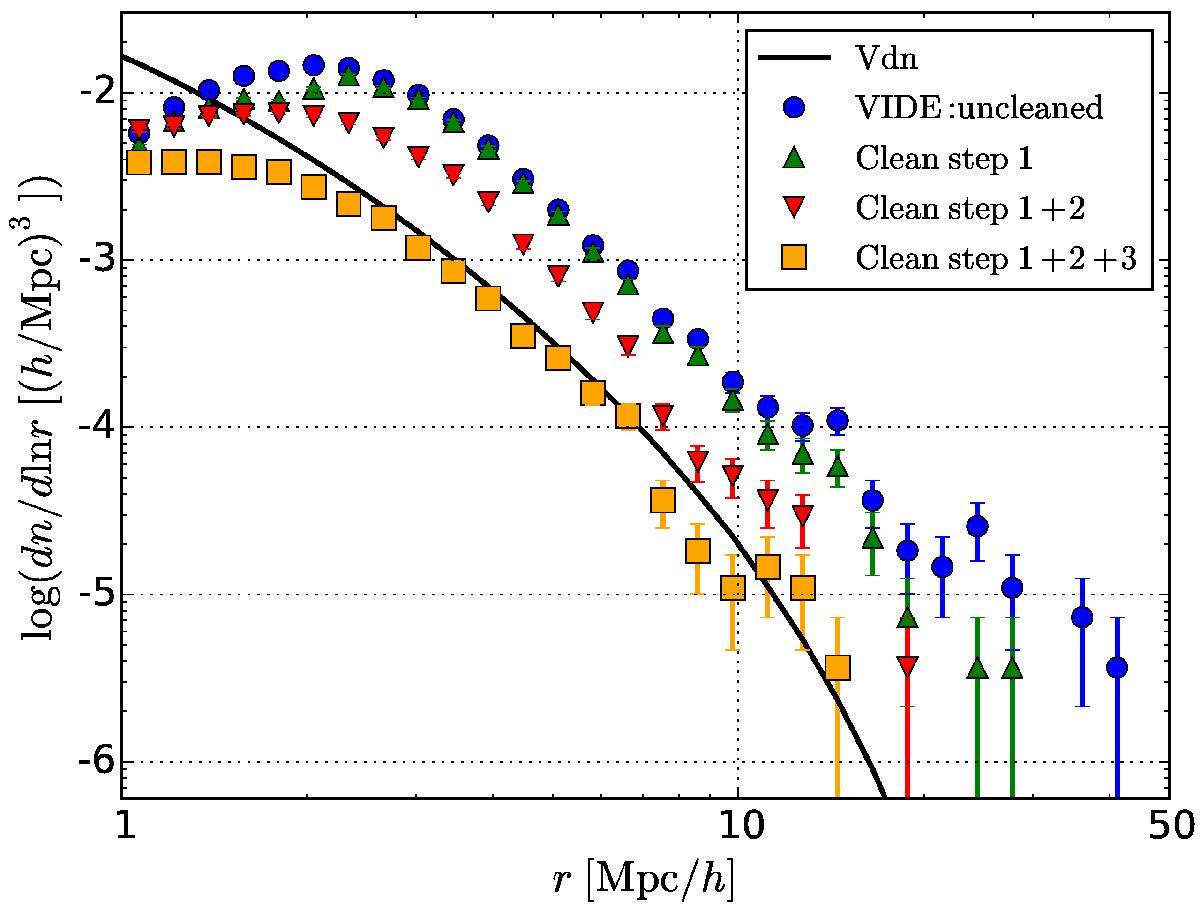
The void size function at the different steps of the cleaning procedure. The blue dots show the distribution of voids detected by VIDE from a ΛCDM N-body simulation. The green triangles are obtained by applying both the rmin−rmax criterion and the central density criterion (first step). The red upside-down triangles show the void distribution after having rescaled the voids (second step), while the orange squares are the final output of the cleaning algorithm in case the larger-favoured overlapping criterion chosen (third step) is the decreasing central density (for the density contrast criterion see Fig. D.1). The black line shows the Vdn model prediction.
Current usage metrics show cumulative count of Article Views (full-text article views including HTML views, PDF and ePub downloads, according to the available data) and Abstracts Views on Vision4Press platform.
Data correspond to usage on the plateform after 2015. The current usage metrics is available 48-96 hours after online publication and is updated daily on week days.
Initial download of the metrics may take a while.