Fig. 8
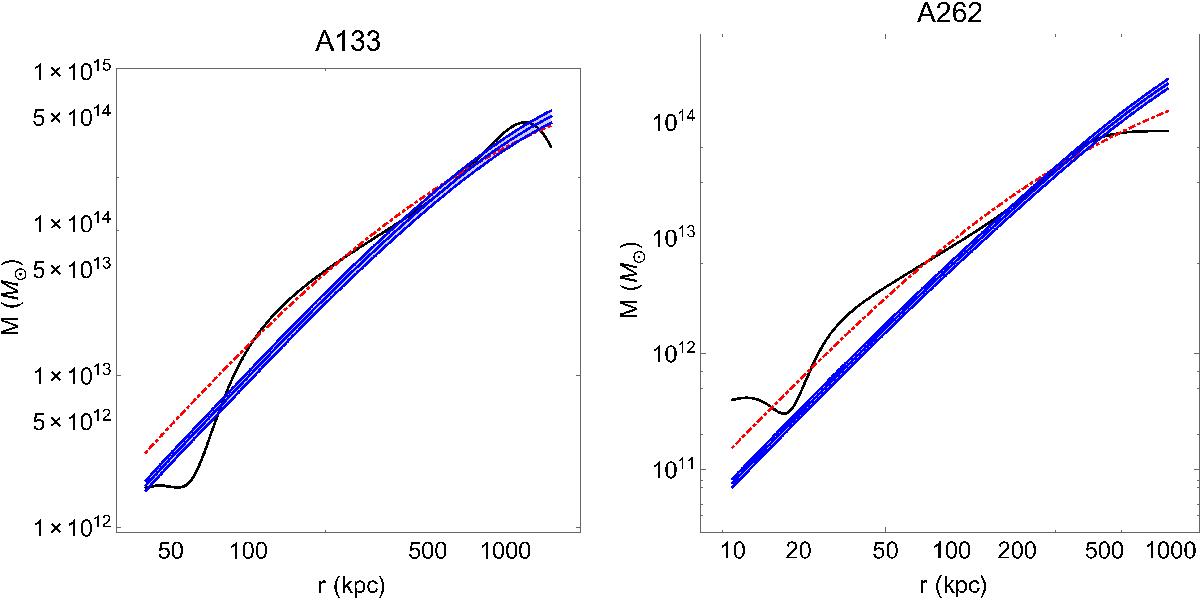
Recreated Figs. 17–22 from Hodson & Zhao (2017) with the modified A0(Φ) function found under the UDG constraints. The red dashed line shows the best-fit ΛCDM model from Vikhlinin et al. (2006), the black line the dynamical mass derived from Eq. (22), and the blue shaded region shows the EMOND-predicted mass. Here we show clusters A133 and A262.
Current usage metrics show cumulative count of Article Views (full-text article views including HTML views, PDF and ePub downloads, according to the available data) and Abstracts Views on Vision4Press platform.
Data correspond to usage on the plateform after 2015. The current usage metrics is available 48-96 hours after online publication and is updated daily on week days.
Initial download of the metrics may take a while.