Fig. 7
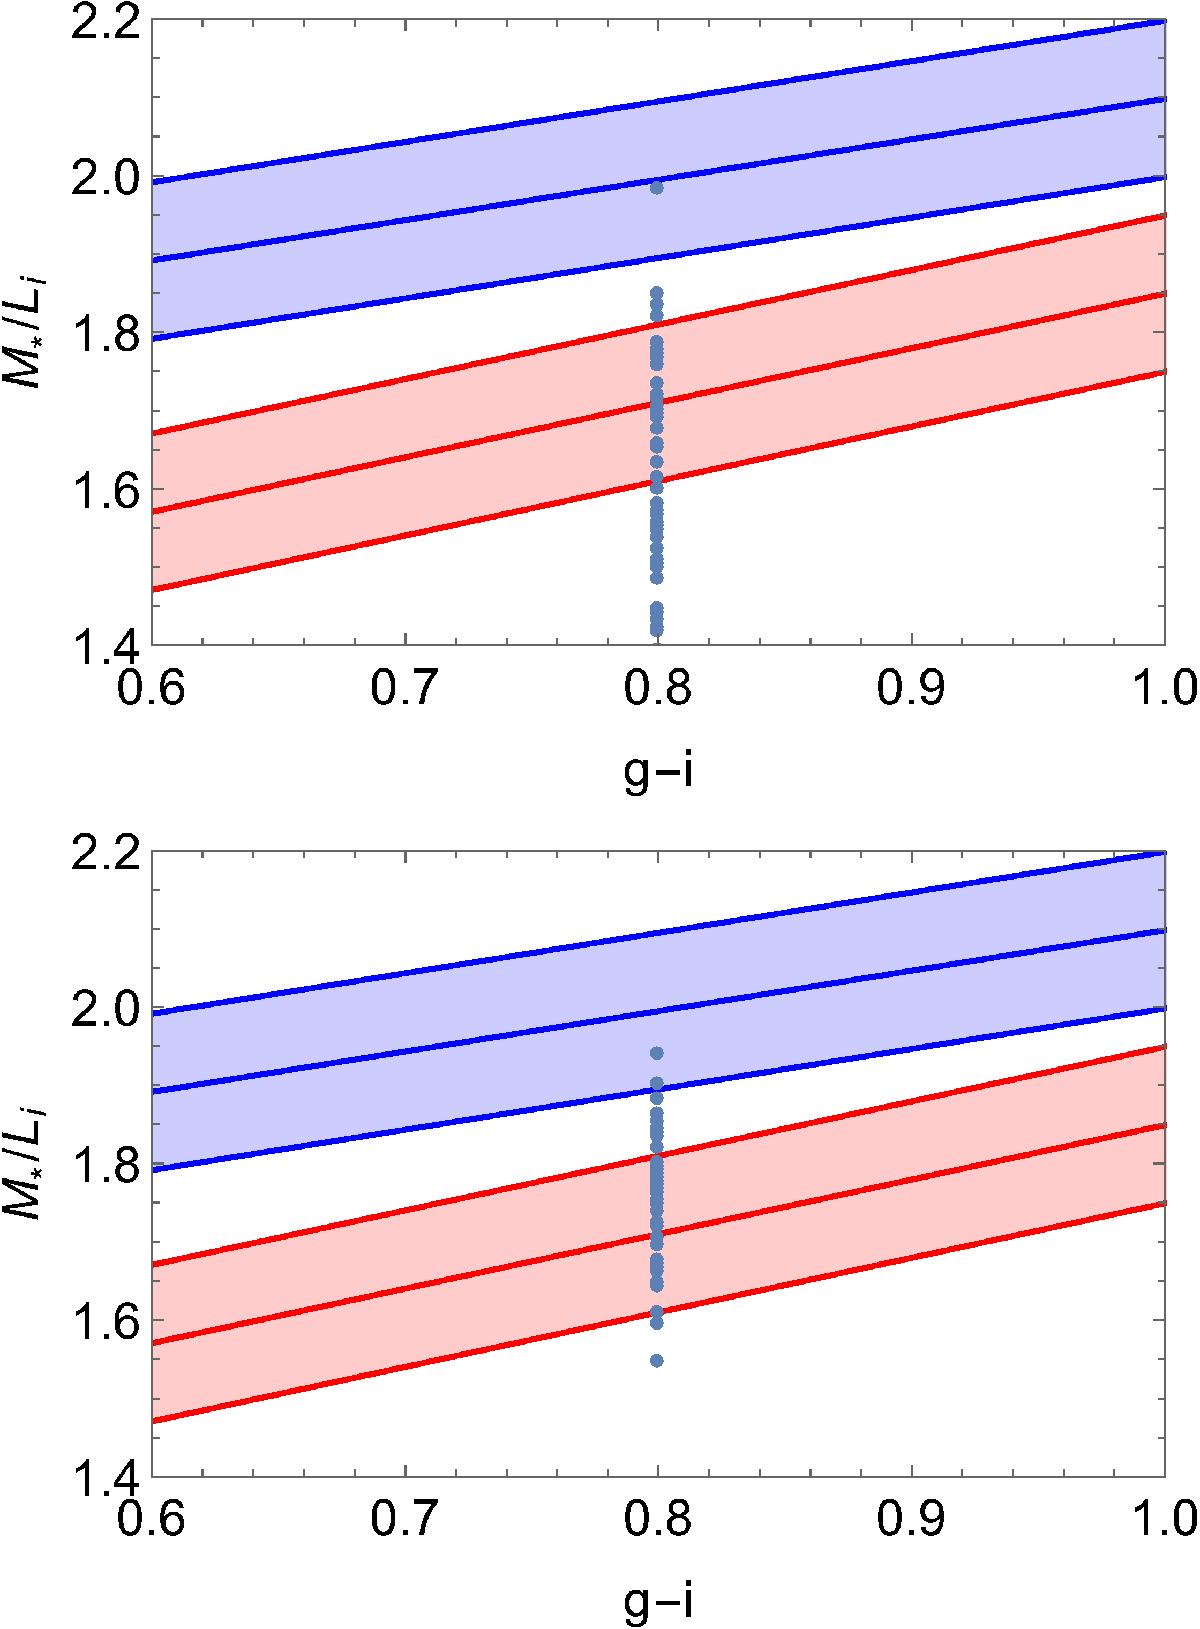
Stellar mass-to-light functions from Taylor et al. (2011; red) and Bell et al. (2003; blue) as a function of g−i colour. We show approximate error bars of 0.1 dex for each case. The top panel shows the results for the q = 2 model, and the bottom panel shows the q = 1 model (see Eq. (6)). The blue dots show where the UDGs must lie assuming that the EMOND formulation is correct. This shows that it may be possible for most of the UDGs to be explained by EMOND within the range of stellar mass-to-light ratio allowed. The q = 1 model again shows better results.
Current usage metrics show cumulative count of Article Views (full-text article views including HTML views, PDF and ePub downloads, according to the available data) and Abstracts Views on Vision4Press platform.
Data correspond to usage on the plateform after 2015. The current usage metrics is available 48-96 hours after online publication and is updated daily on week days.
Initial download of the metrics may take a while.