Fig. 2
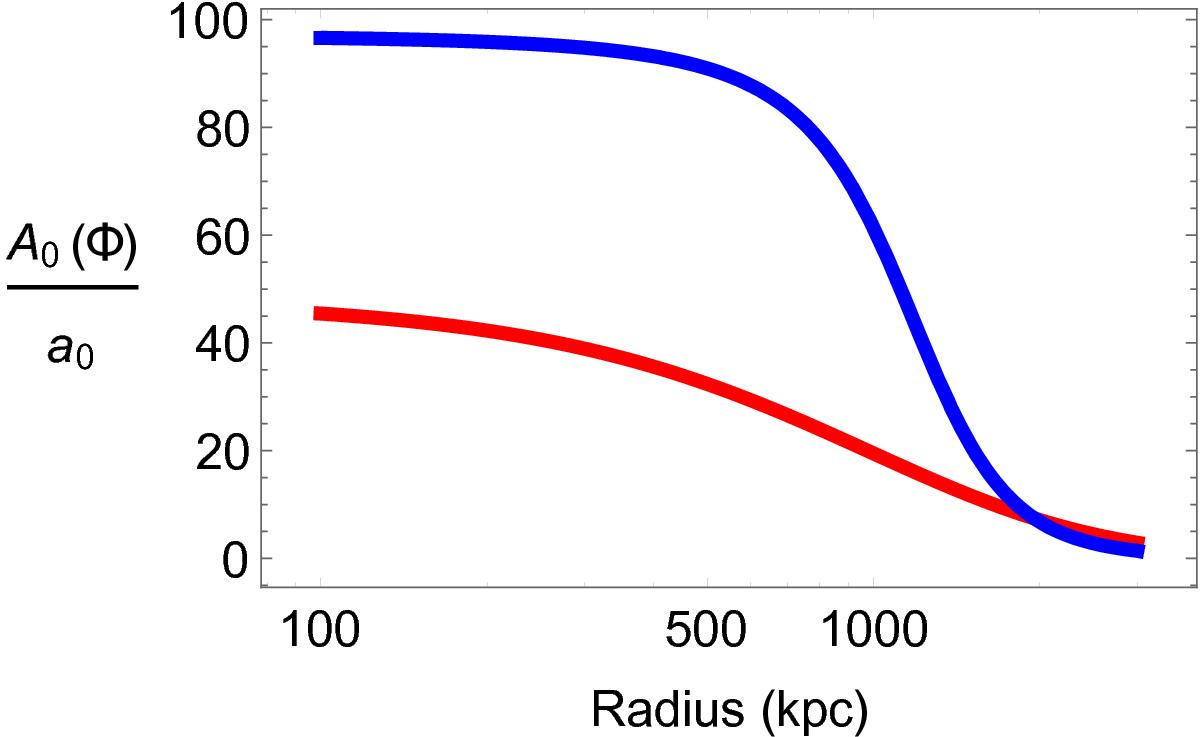
Profile of the EMOND-calculated A0(Φ) /a0 as a function of cluster radius. The blue dashed line is the q = 2 model, and the red solid line is the q = 1 model. The q = 1 model produces a shallower transition from high to low A0(Φ) and a smaller magnitude of A0(Φ) than the q = 2 model (see Eq. (6)). We only show radii > 100 kpc as this is the important range for the UDGs.
Current usage metrics show cumulative count of Article Views (full-text article views including HTML views, PDF and ePub downloads, according to the available data) and Abstracts Views on Vision4Press platform.
Data correspond to usage on the plateform after 2015. The current usage metrics is available 48-96 hours after online publication and is updated daily on week days.
Initial download of the metrics may take a while.