Fig. 1
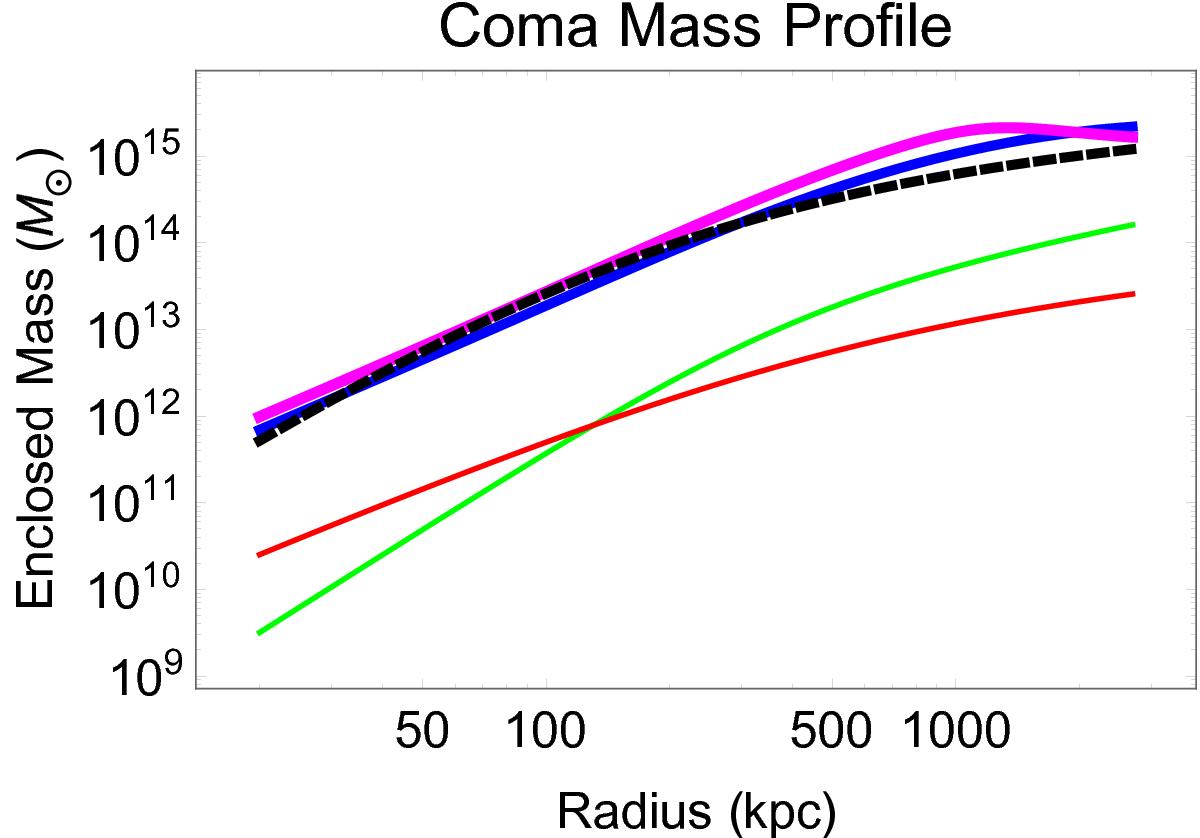
Model of the Coma cluster that we adopt from Łokas & Mamon (2003). The green thin line shows the contribution from the intra-cluster gas, and the red thin line is the contribution from the stars. Using these, we can calculate the EMOND-predicted dynamical mass from Eq. (10), which is the solid blue line for the q = 1 model and the solid magenta line for the q = 2 model (see Eq. (6)). We also plot the dark matter profile from Łokas & Mamon (2003; black dashed line) for comparison. We see that our EMOND mass matches the dark matter mass very well. For this, we assumed an EMOND boundary potential at the virial radius Φ(rv) = −2.5 × 10¹² m2 s-2.
Current usage metrics show cumulative count of Article Views (full-text article views including HTML views, PDF and ePub downloads, according to the available data) and Abstracts Views on Vision4Press platform.
Data correspond to usage on the plateform after 2015. The current usage metrics is available 48-96 hours after online publication and is updated daily on week days.
Initial download of the metrics may take a while.