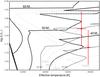
Fig. 8
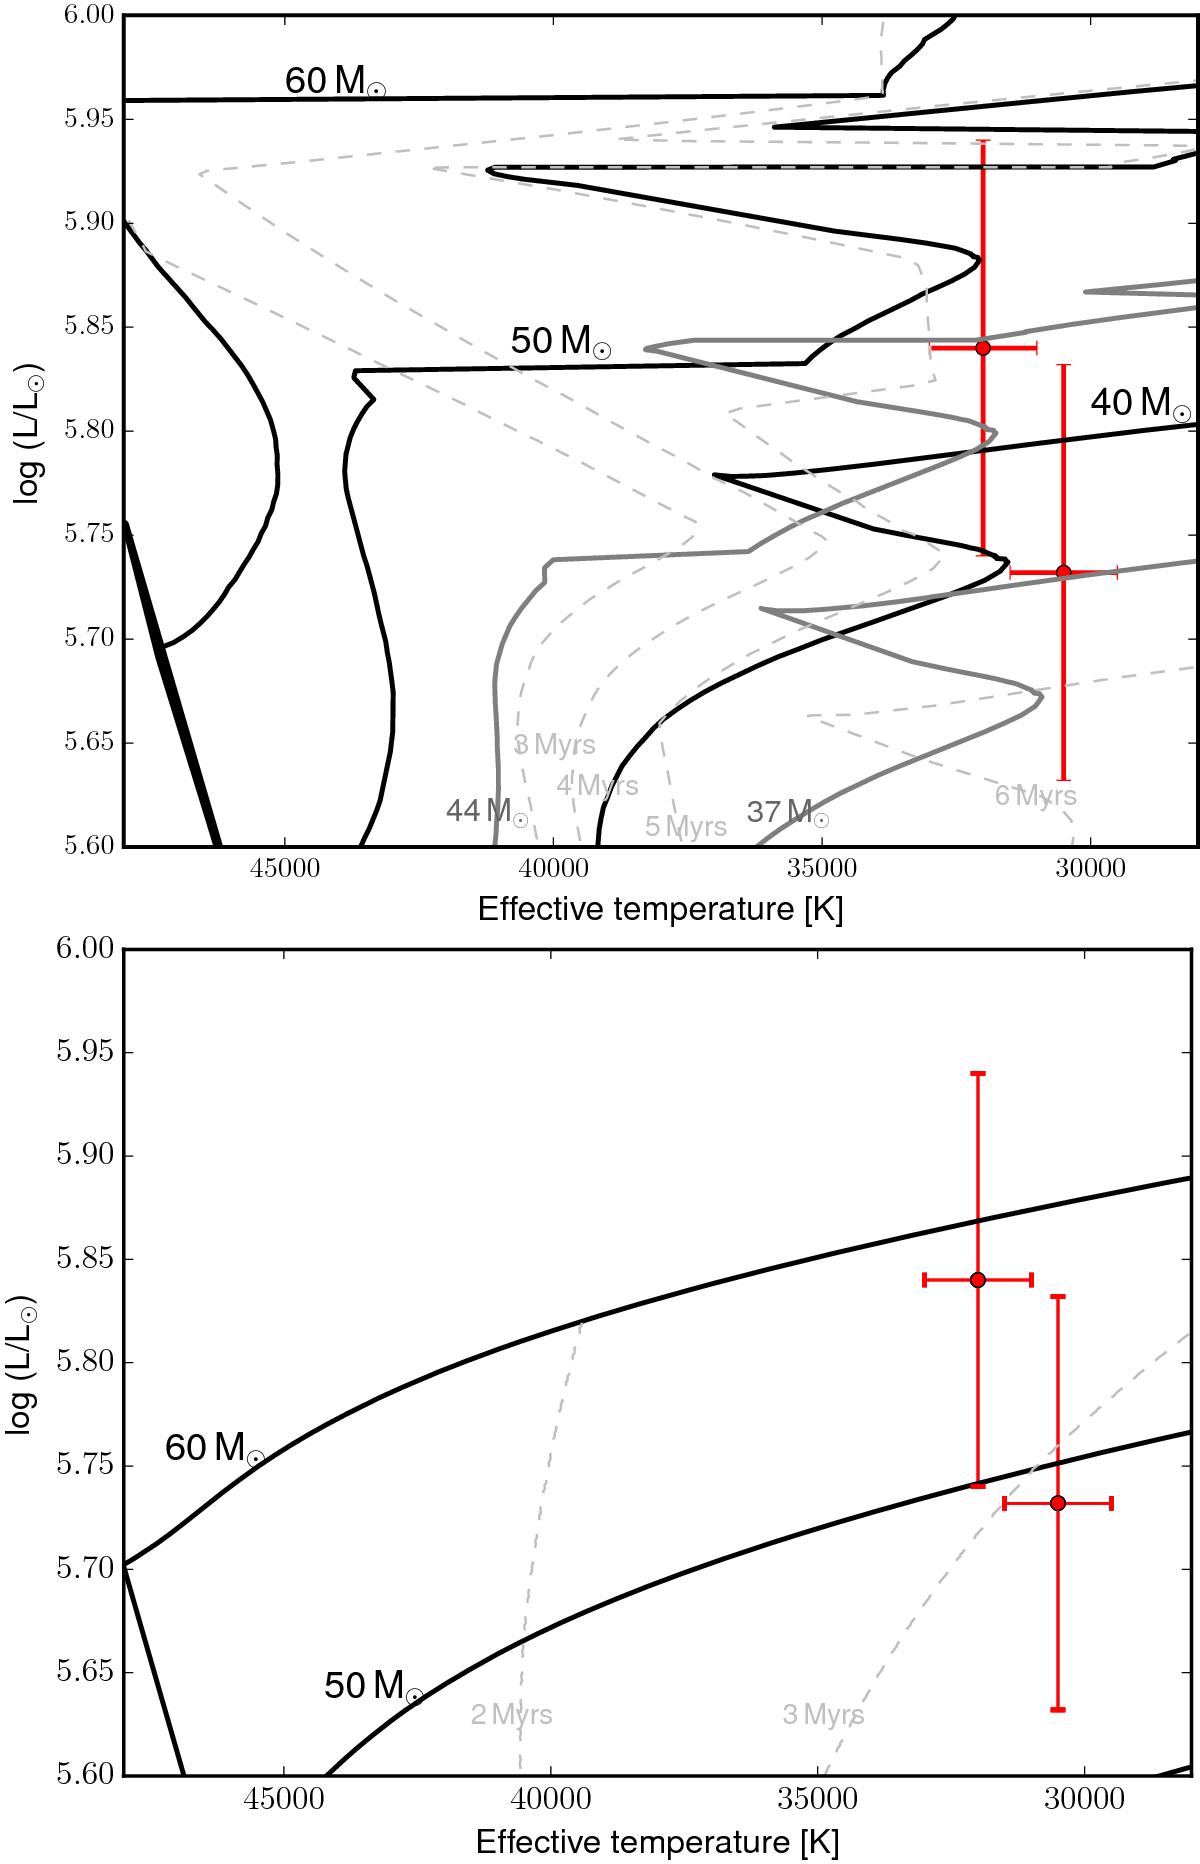
Positions in the HR diagram of the two components of HD 166734. Top: evolutionary tracks (black lines) and isochrones (gray lines) from Ekström et al. (2012), computed with a rotational rate of 300 km s-1. Bottom: evolutionary tracks (black lines) and isochrones (gray lines) from Brott et al. (2011), computed with a rotational rate of 160 km s-1. The error bars represent the 1σ.
Current usage metrics show cumulative count of Article Views (full-text article views including HTML views, PDF and ePub downloads, according to the available data) and Abstracts Views on Vision4Press platform.
Data correspond to usage on the plateform after 2015. The current usage metrics is available 48-96 hours after online publication and is updated daily on week days.
Initial download of the metrics may take a while.