Free Access
Fig. 7
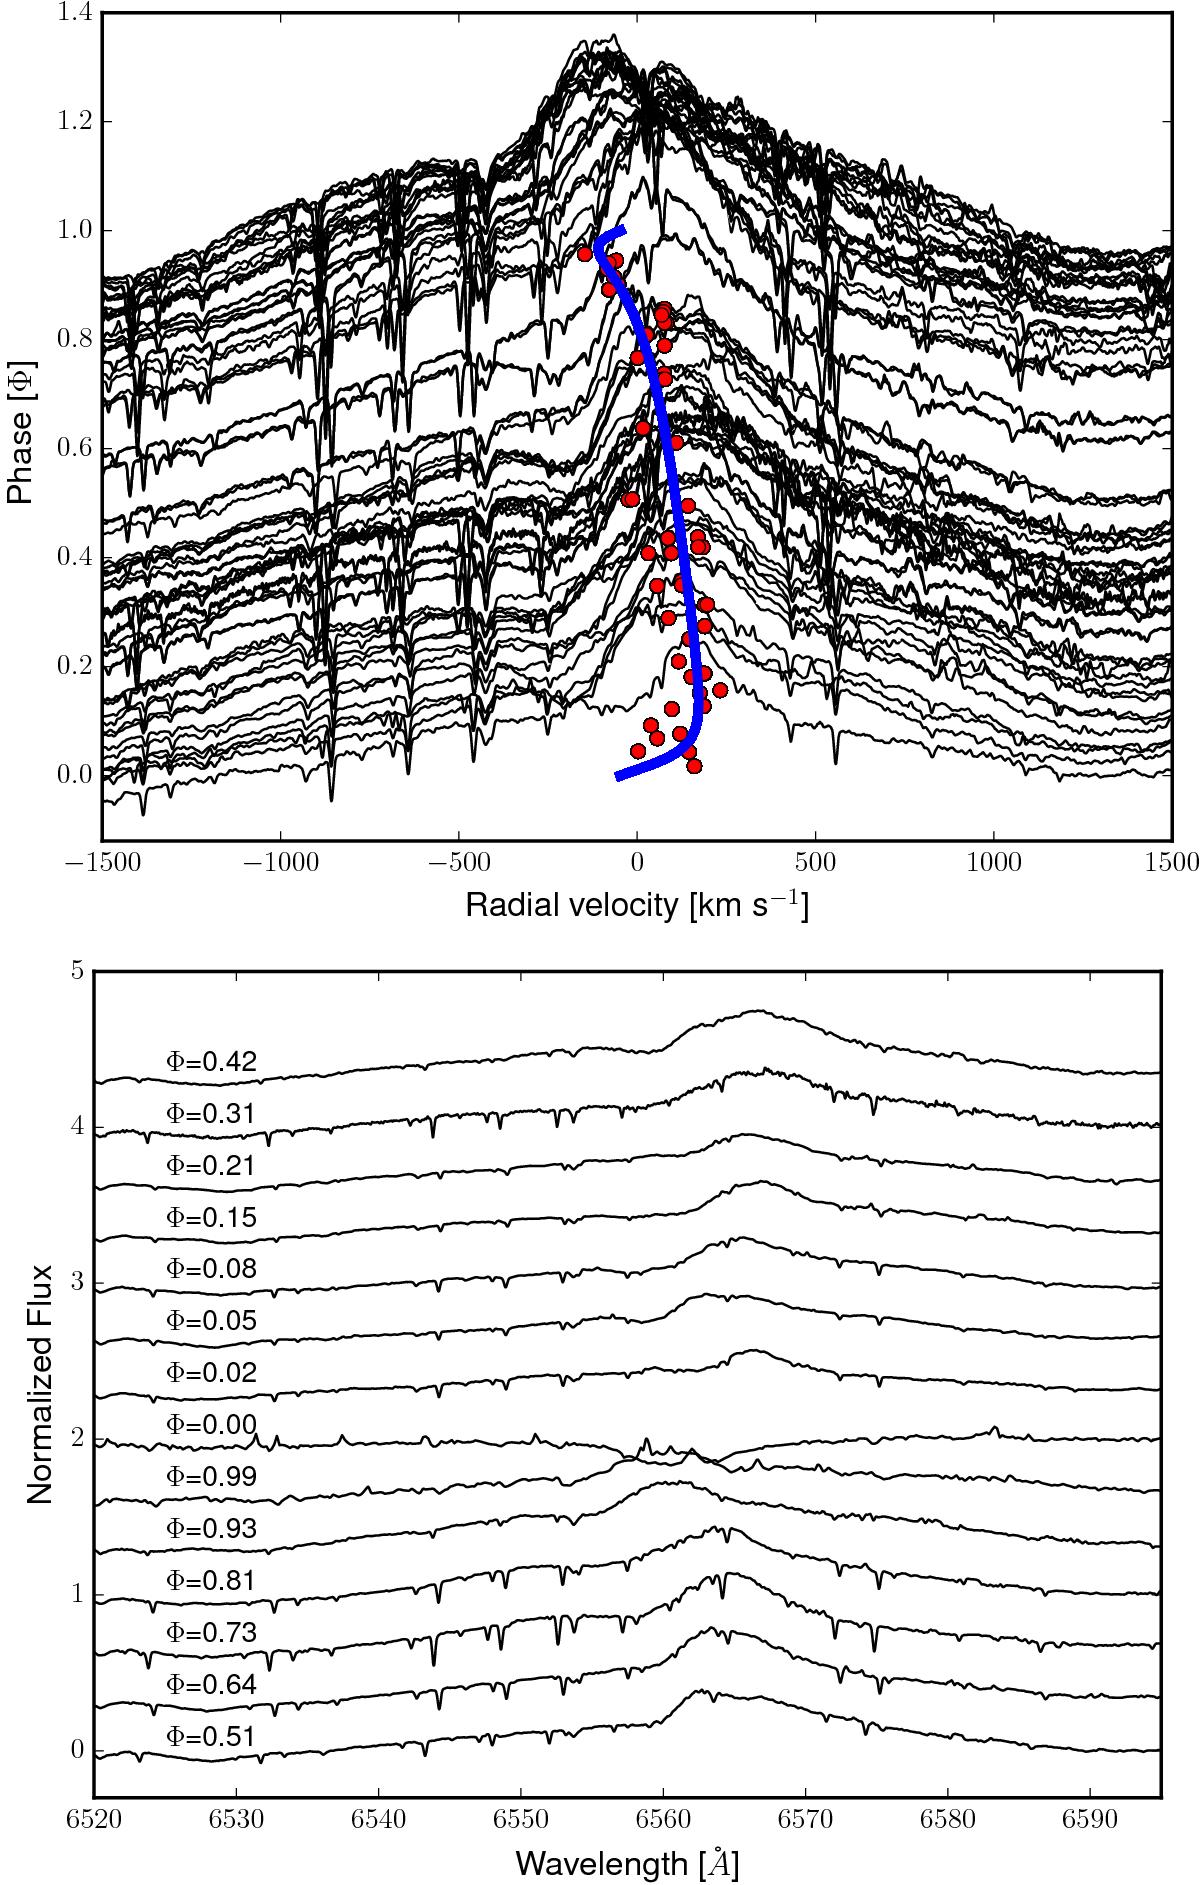
Top: positions of the maximum of Hα emission as a function of the orbital phase. The red dots represent the positions of the maximum, whilst the blue line is the radial velocity curve of the primary component. Bottom: spectral variation of the Hα line as a function of the orbital phase. The emission vanishes at Φ = 0.00.
This figure is made of several images, please see below:
Current usage metrics show cumulative count of Article Views (full-text article views including HTML views, PDF and ePub downloads, according to the available data) and Abstracts Views on Vision4Press platform.
Data correspond to usage on the plateform after 2015. The current usage metrics is available 48-96 hours after online publication and is updated daily on week days.
Initial download of the metrics may take a while.