Fig. 3
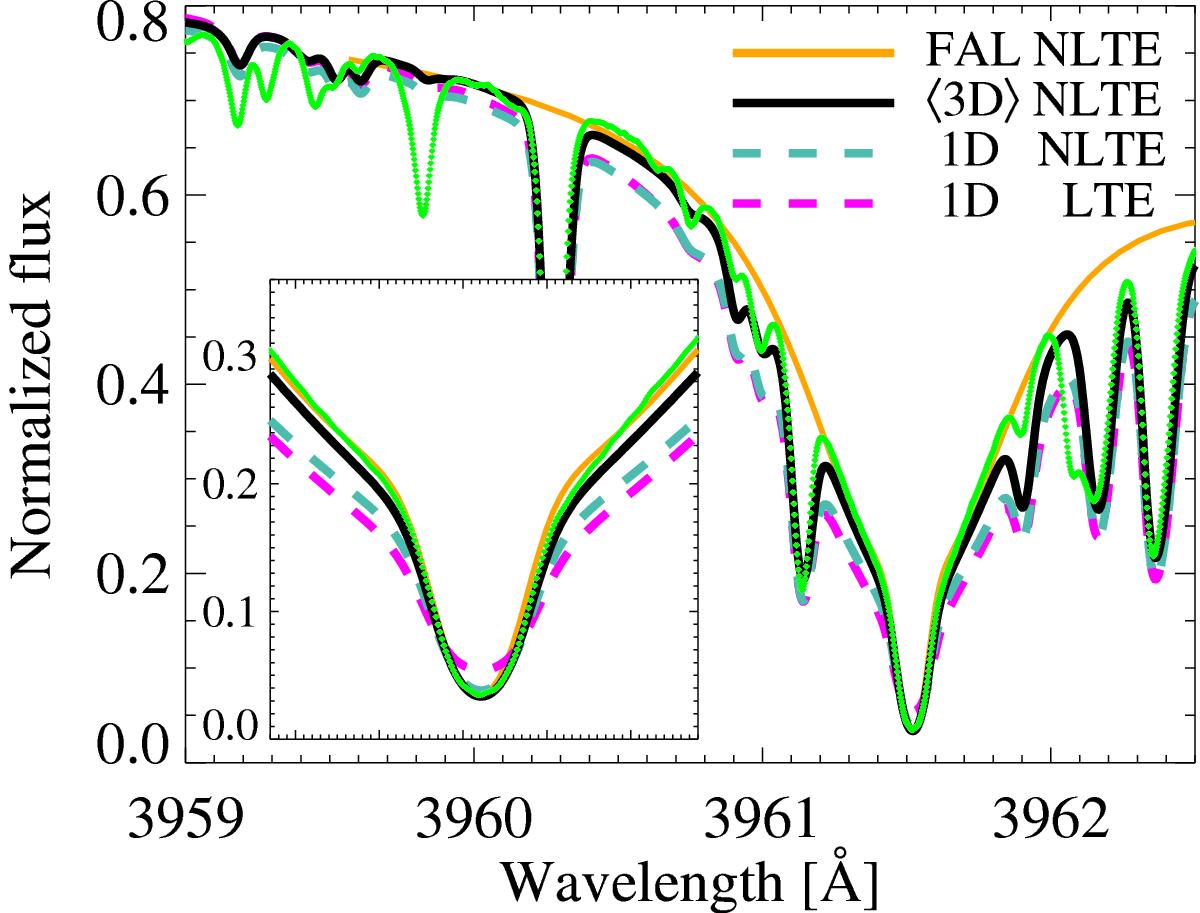
Solar resonance line, comparing the KPNO flux atlas to NLTE synthesis using the FALC chromospheric solar model, as well as stagger⟨ 3D ⟩ and MARCS 1D models, computed with A(Al) = 6.43. LTE synthesis is also shown for the 1D MARCS model. The FALC spectrum does not take into account minor line blends. The inset shows a zoom on the core region.
Current usage metrics show cumulative count of Article Views (full-text article views including HTML views, PDF and ePub downloads, according to the available data) and Abstracts Views on Vision4Press platform.
Data correspond to usage on the plateform after 2015. The current usage metrics is available 48-96 hours after online publication and is updated daily on week days.
Initial download of the metrics may take a while.