Fig. 8
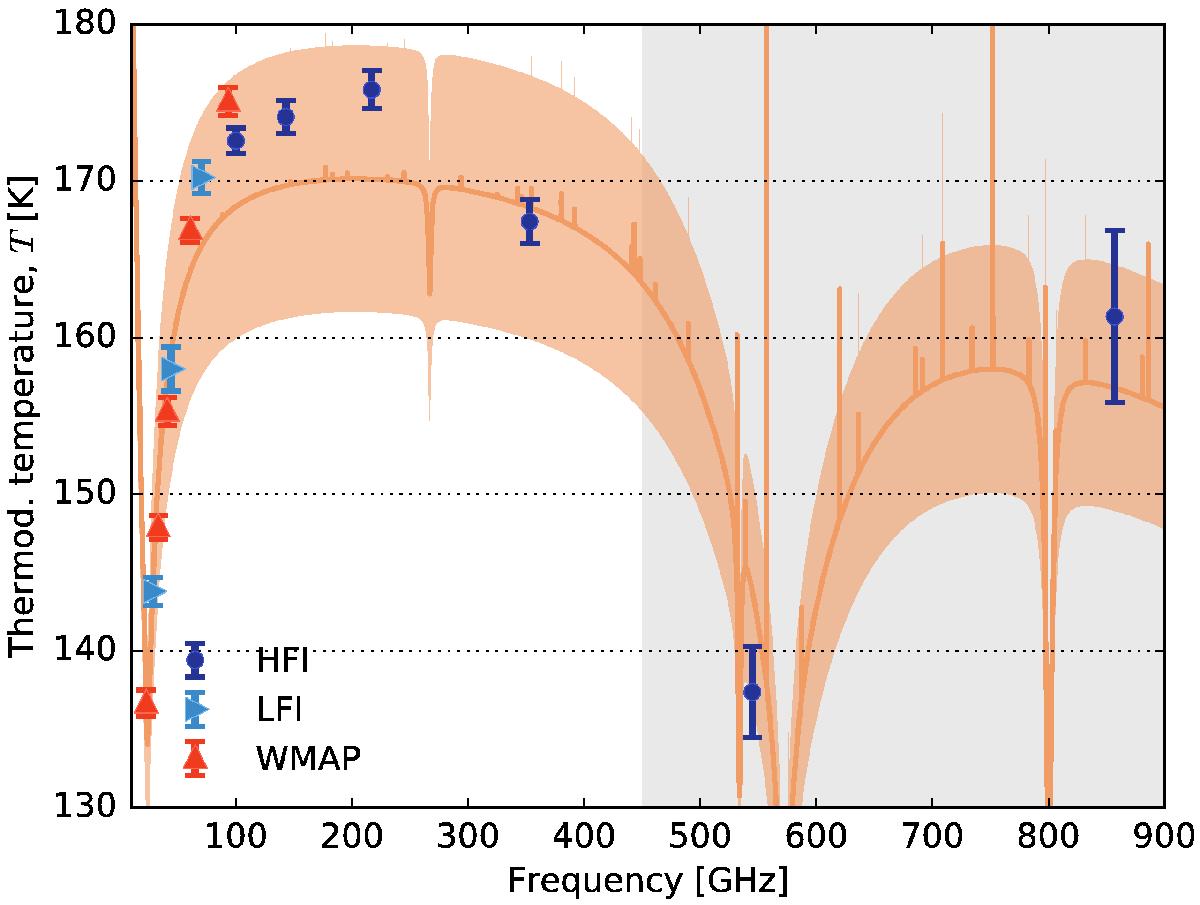
Measured thermodynamic temperature for the five Planck-HFI observations of Jupiter as well as Planck-LFI results (Planck Collaboration V 2016). Points and error bars represent average (maximum likelihood) thermodynamic temperature and associated errors (including systematic error). The orange line and region represent the ESA1 model predictions and the estimated absolute uncertainties. We note the ammonia absorption line at 572.5 GHz. Emission lines are due to stratospheric emission from H2O, CO, CS, and HCN. WMAP measurements are included for comparison (Bennett et al. 2013). The grey region is there to remind the reader that the sub-mm bands are calibrated on models of the brightness of Uranus and Neptune (see Sect. 2.1.2).
Current usage metrics show cumulative count of Article Views (full-text article views including HTML views, PDF and ePub downloads, according to the available data) and Abstracts Views on Vision4Press platform.
Data correspond to usage on the plateform after 2015. The current usage metrics is available 48-96 hours after online publication and is updated daily on week days.
Initial download of the metrics may take a while.