Fig. 6
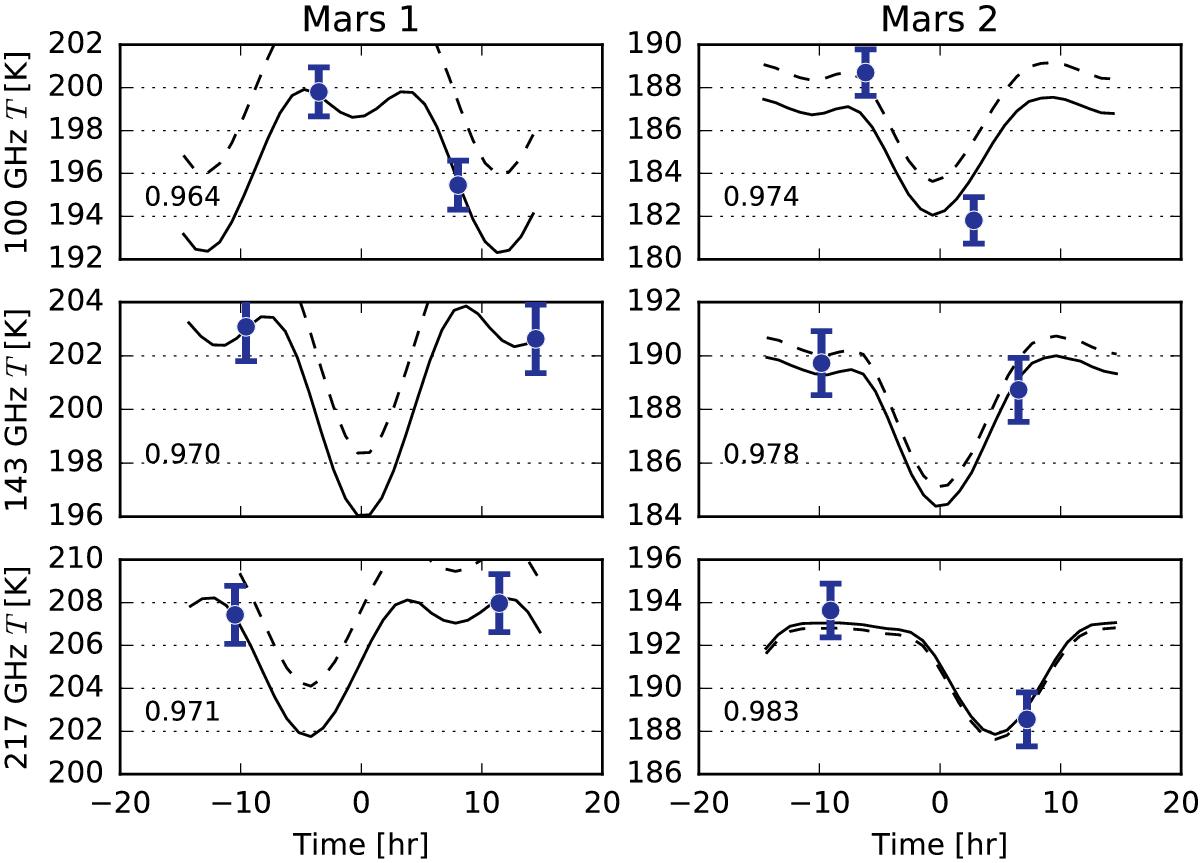
Estimates of the thermodynamic temperature of Mars compared to a model for diurnal variations. The panel columns correspond to the first two Mars observations while the rows represent estimates at 100, 143, and 217 GHz. The model output has been scaled by ζP = 0.982 (dashed line) and a variable best-fit scale (solid line), which is annotated in each panel. The horizontal axis shows time relative to the mean observation time for that frequency band. Error bars show systematic and statistical uncertainties summed in quadrature.
Current usage metrics show cumulative count of Article Views (full-text article views including HTML views, PDF and ePub downloads, according to the available data) and Abstracts Views on Vision4Press platform.
Data correspond to usage on the plateform after 2015. The current usage metrics is available 48-96 hours after online publication and is updated daily on week days.
Initial download of the metrics may take a while.