Fig. 4
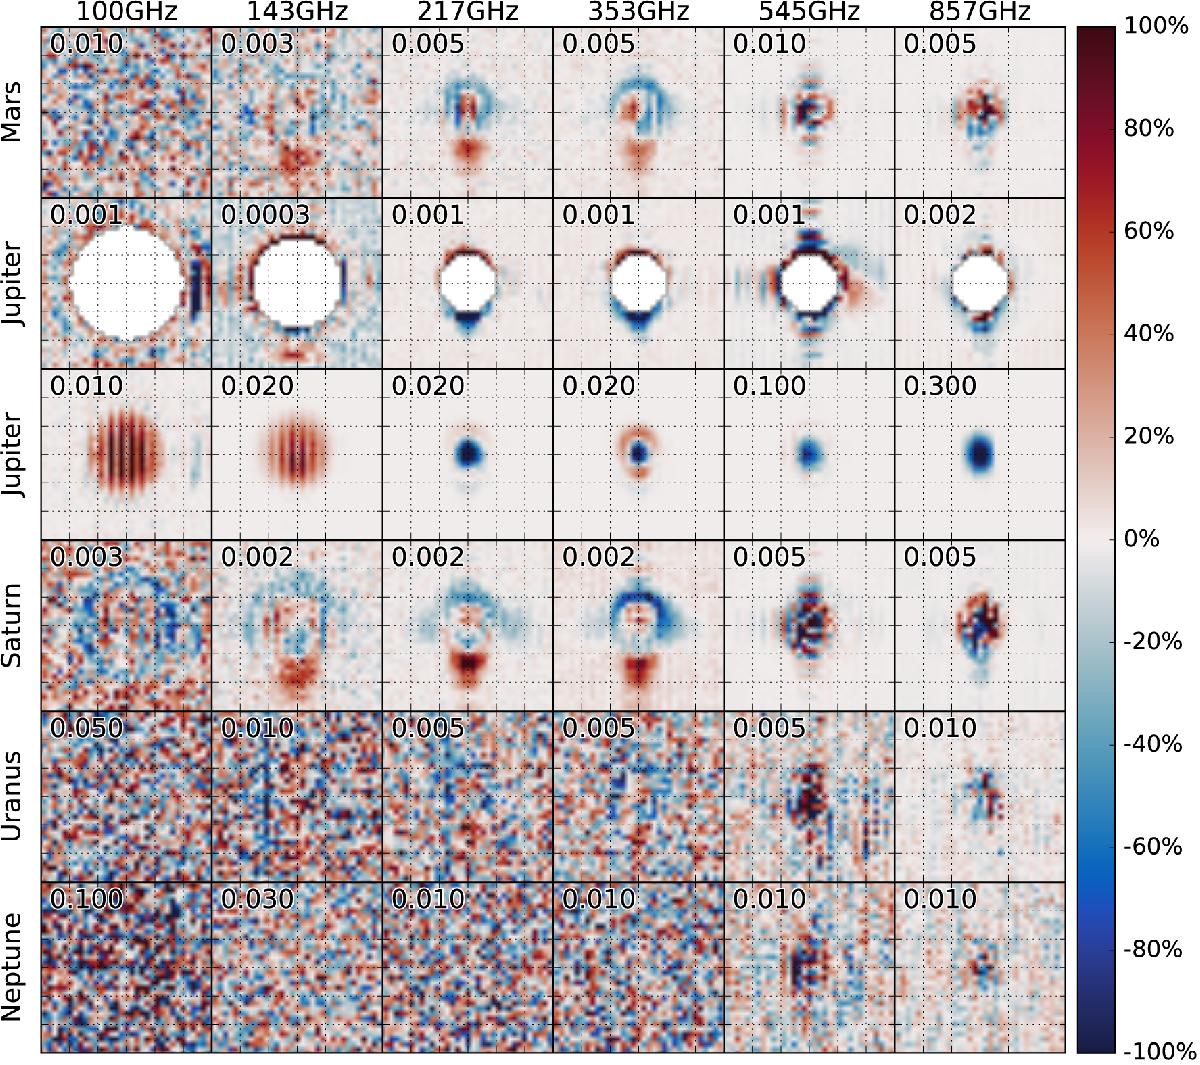
Maps of the normalized and background-subtracted timeline residuals, (si − D(θi,φi) − ΔTpP(θi,φi)) / ΔTp, combining all available observations and detectors within a frequency band. The number shown in the top left corner of each panel represents the extent of the colour scale, e.g., a value of 0.01 means that the darkest colour corresponds to a 0.01 deviation from the peak response ΔTp, with red (blue) corresponding to positive (negative) deviation. For Jupiter, we present two versions of the same plot. In one of the two versions, we have masked out the centres of the Jupiter observations, since nonlinearity and saturation lead to a large residual, especially at high frequencies. Each panel is 30′× 30′, and the co-scan direction is vertical on these plots (see discussion in Sect. 1).
Current usage metrics show cumulative count of Article Views (full-text article views including HTML views, PDF and ePub downloads, according to the available data) and Abstracts Views on Vision4Press platform.
Data correspond to usage on the plateform after 2015. The current usage metrics is available 48-96 hours after online publication and is updated daily on week days.
Initial download of the metrics may take a while.