Fig. 3
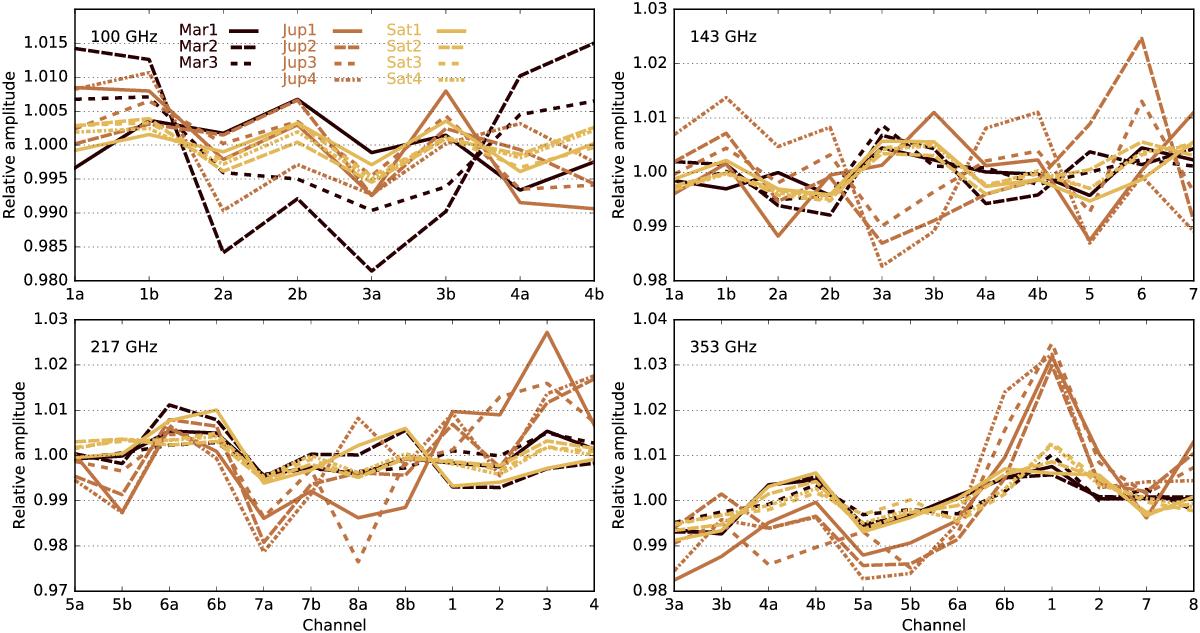
Relative amplitude in derived flux density from observations of Jupiter, Saturn, and Mars at 100–353 GHz (Mars is limited by statistical error at 100 GHz). The flux density has been normalized to the band-mean. A clear correlation in relative flux amplitudes between planet observation periods is seen. Lines are used to guide the eye between flux values within a planet observation. For the top panel (100 GHz), the average standard deviation of the data is approximately 0.4%.
Current usage metrics show cumulative count of Article Views (full-text article views including HTML views, PDF and ePub downloads, according to the available data) and Abstracts Views on Vision4Press platform.
Data correspond to usage on the plateform after 2015. The current usage metrics is available 48-96 hours after online publication and is updated daily on week days.
Initial download of the metrics may take a while.