Fig. 2
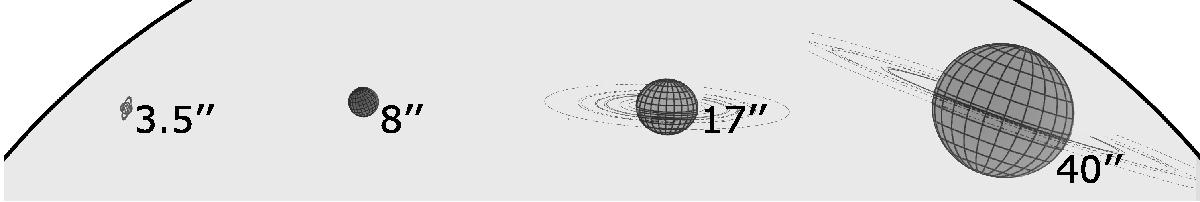
Composite diagram showing four planets as viewed from the centre of Earth around the turn of the year 2010; the view from L2 would have been similar. From left to right, the figure shows Uranus, Mars, Saturn, and Jupiter. The planets are drawn on the same scale and the numbers to the right of each planet represent the approxiate apparent diameter (in arcmin) of the planets at this particular epoch. A fraction of a typical 143 GHz beam is shown by the black line and large grey region, the diameter of this circle corresponds to the FWHM of the beam. This suggests that the planets are point sources relative to the spatial response of the instrument. The planet diagrams have been extracted from Showalter (2014).
Current usage metrics show cumulative count of Article Views (full-text article views including HTML views, PDF and ePub downloads, according to the available data) and Abstracts Views on Vision4Press platform.
Data correspond to usage on the plateform after 2015. The current usage metrics is available 48-96 hours after online publication and is updated daily on week days.
Initial download of the metrics may take a while.