Fig. 11
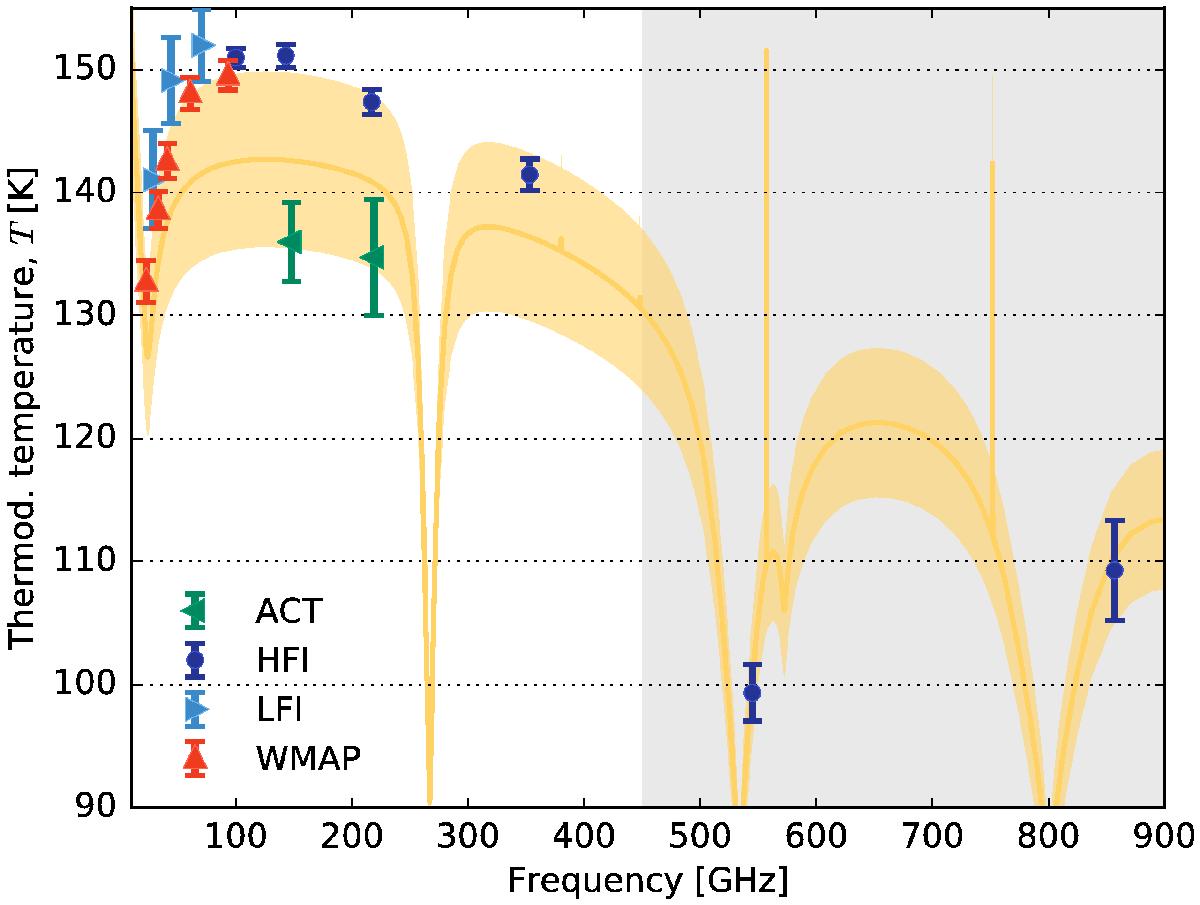
Thermodynamic temperature of Saturn’s disc as calculated from the four Planck-HFI observations compared with the ESA2 model output. The LFI data at 28, 44, and 70 GHz are taken from Planck Collaboration V (2014), but corrected for disc oblateness and ring contributions. The three prominent absorption lines, including the one at 530 GHz, are phosphine (PH3) related (Weisstein 1996). Emission lines are due to stratospheric emission from H2O. WMAP and ACT measurements are included here for comparison (Bennett et al. 2013; Hasselfield et al. 2013; Louis et al. 2014).
Current usage metrics show cumulative count of Article Views (full-text article views including HTML views, PDF and ePub downloads, according to the available data) and Abstracts Views on Vision4Press platform.
Data correspond to usage on the plateform after 2015. The current usage metrics is available 48-96 hours after online publication and is updated daily on week days.
Initial download of the metrics may take a while.