Fig. 9
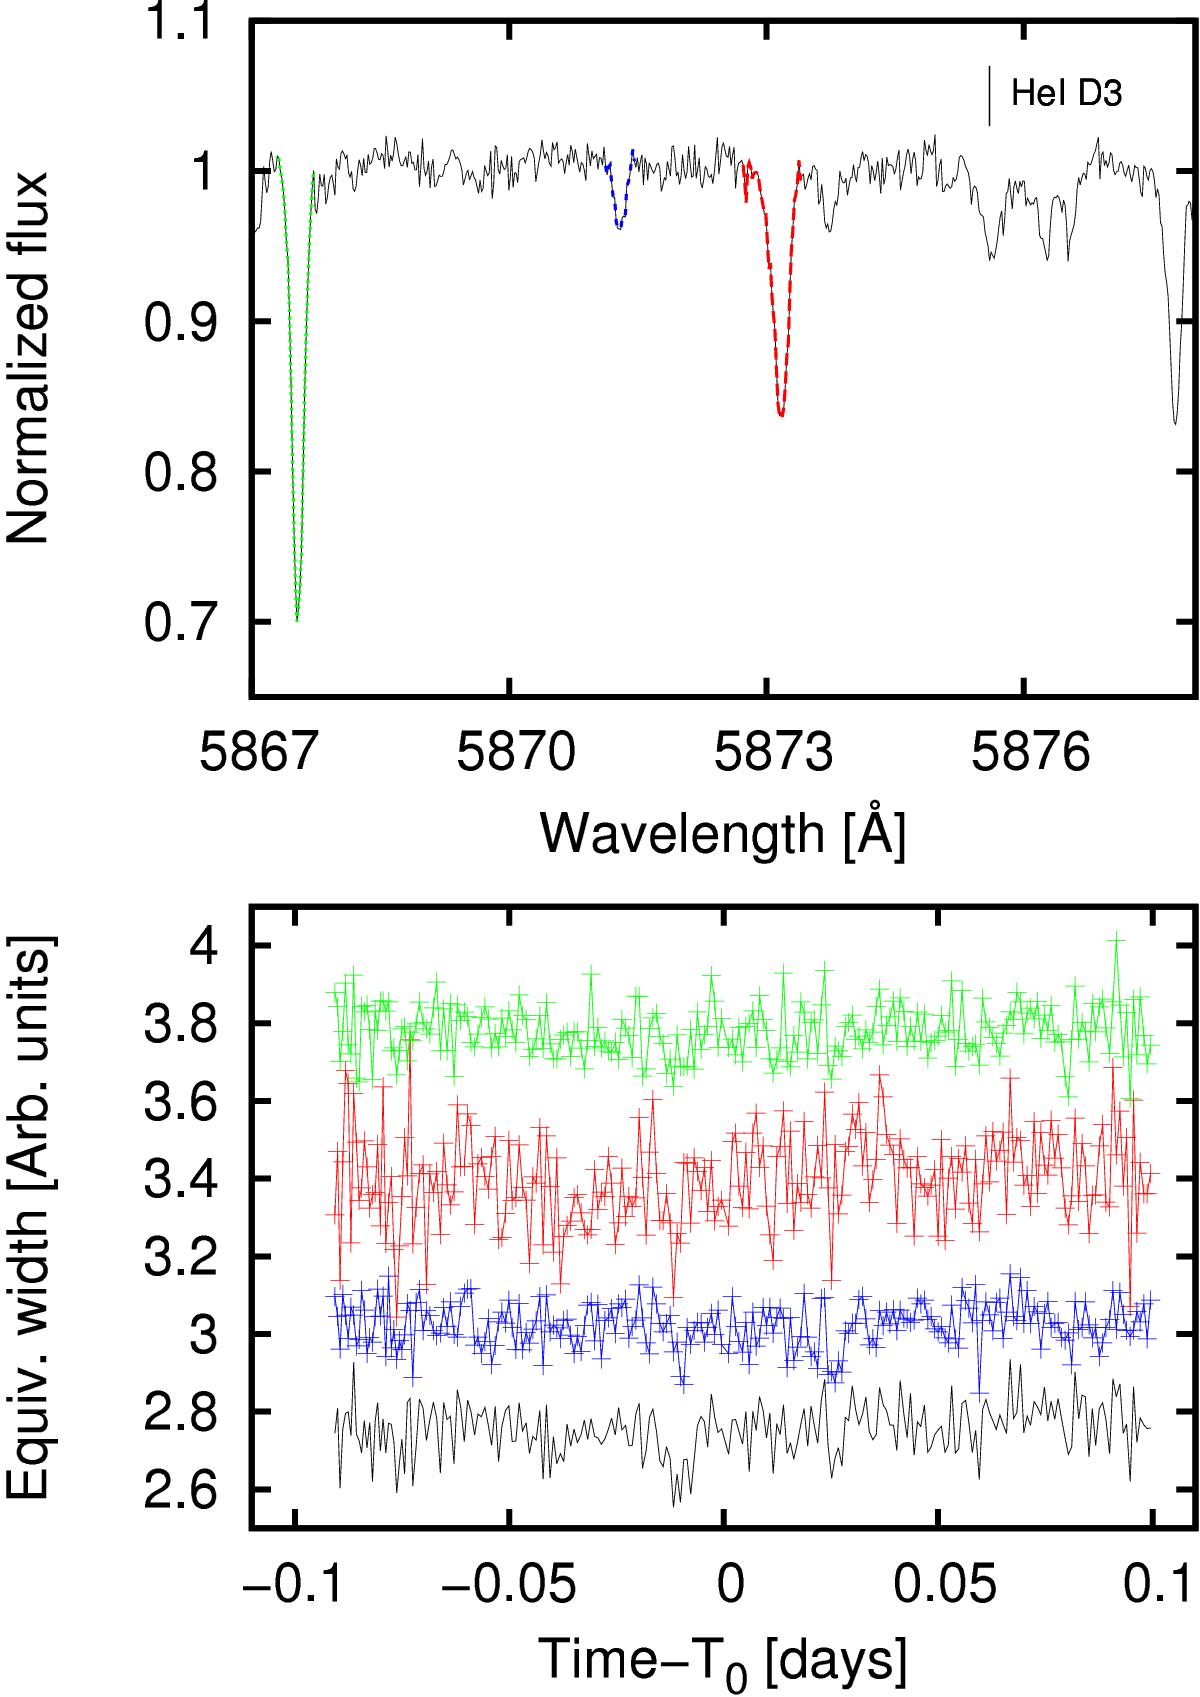
Top: spectral region around He i D3 line. Neighboring photospheric lines used for the behavior check are marked with different colors. Bottom: evolution of the equivalent width of the selected photospheric lines (marked with the same colors) and of a continuum in the vicinity of the He i D3 line (black line). The curves were scaled for better comparison. The center of the x axis (time = 0 days) corresponds to the middle of the transit T0 [HJD,UTC] = 2 456 109.26164.
Current usage metrics show cumulative count of Article Views (full-text article views including HTML views, PDF and ePub downloads, according to the available data) and Abstracts Views on Vision4Press platform.
Data correspond to usage on the plateform after 2015. The current usage metrics is available 48-96 hours after online publication and is updated daily on week days.
Initial download of the metrics may take a while.