Fig. 8
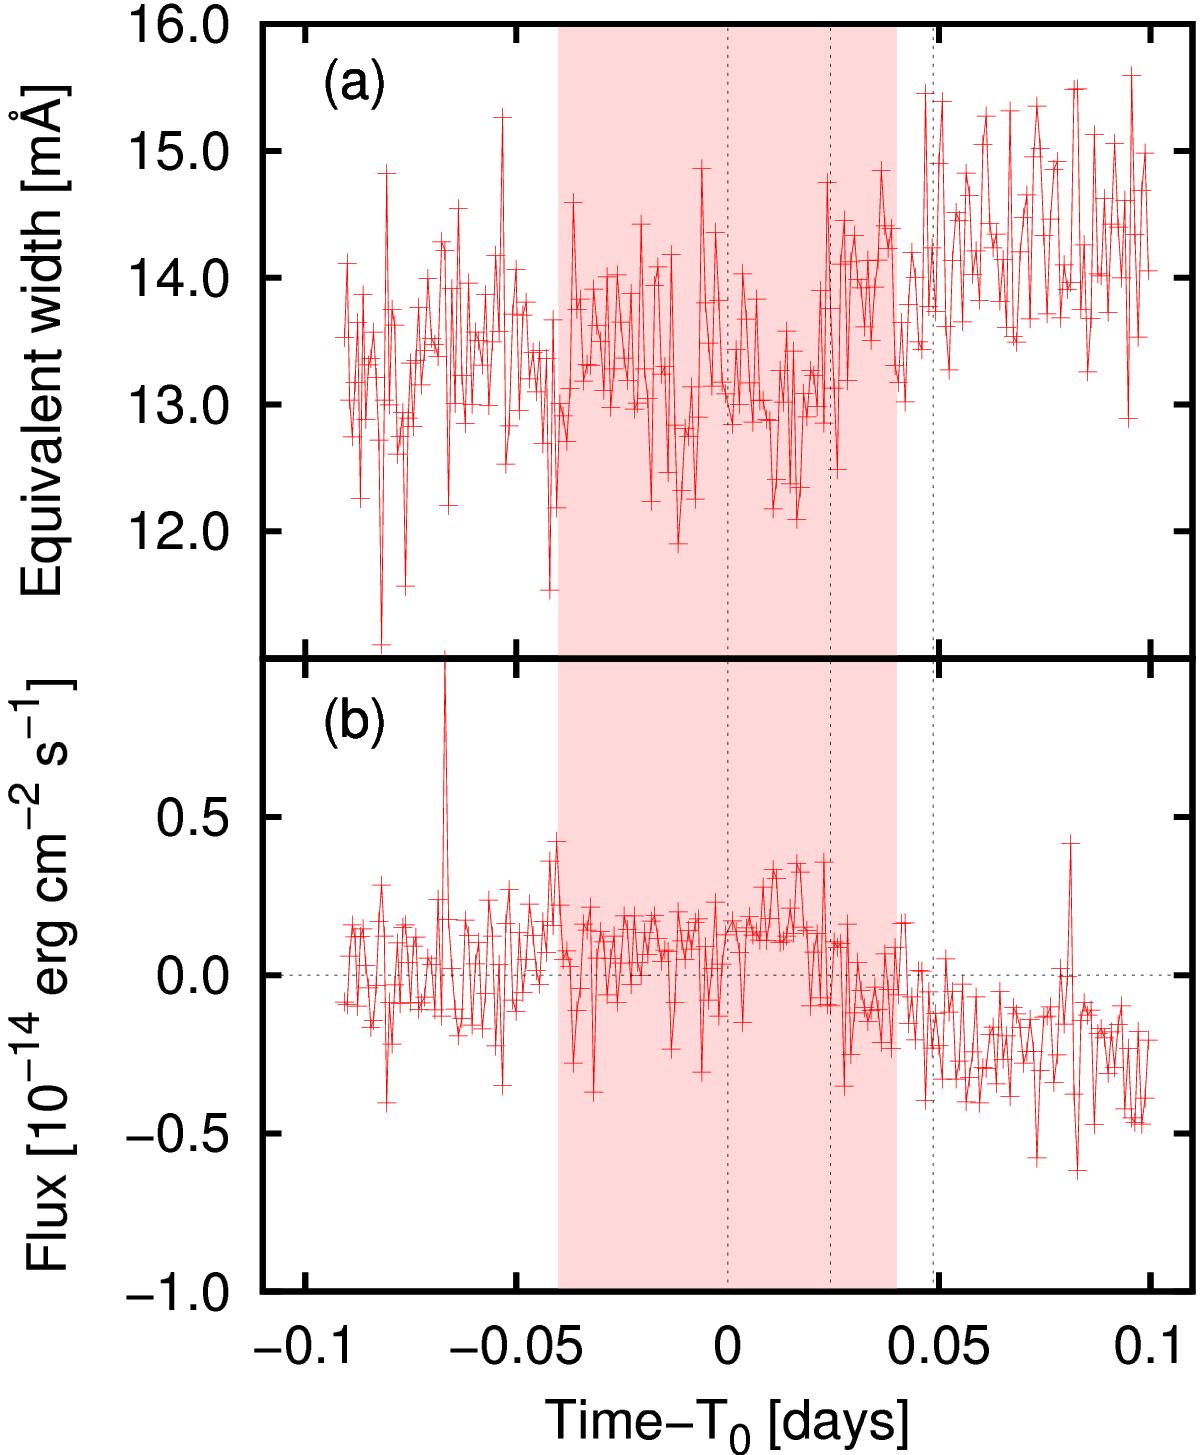
Panel a: evolution of the He i D3 line equivalent width. Panel b: evolution of the excess equivalent width, Wex, in the core of the He i D3 line converted into the flux measured at Earth (see also Fig. 7). Shaded pink area indicates the duration of an exoplanetary transit. Meaning of dashed lines from left to right: middle of the transit T0 [HJD,UTC] = 2 456 109.26164; start of the rise phase; end of the rise phase. The 1σ error for the displayed data points is within the 4−6% range.
Current usage metrics show cumulative count of Article Views (full-text article views including HTML views, PDF and ePub downloads, according to the available data) and Abstracts Views on Vision4Press platform.
Data correspond to usage on the plateform after 2015. The current usage metrics is available 48-96 hours after online publication and is updated daily on week days.
Initial download of the metrics may take a while.