Fig. 7
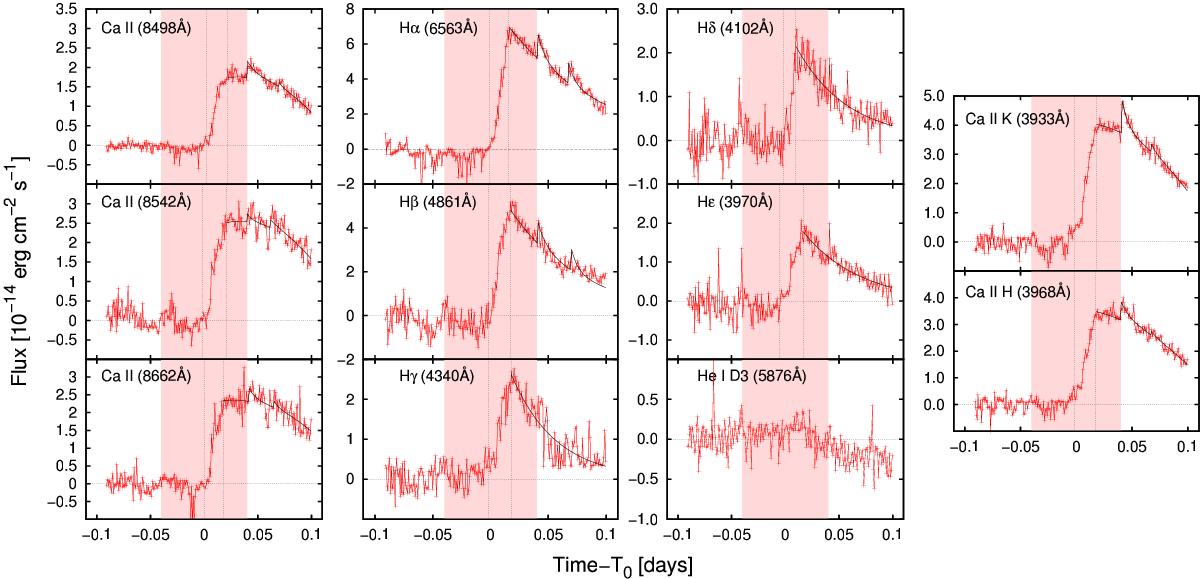
Evolution of a flare in selected chromospheric optical lines. The y axis is the flux measured at Earth, x axis is time in days. The center of the x axis (time = 0 days) corresponds to the middle of the transit (T0 [HJD,UTC] = 2 456 109.26164). Red crosses are the measured flux value. Full black lines represent a best fit of the flare decay phase. Dashed black vertical lines mark a beginning and peak of the flare for each line individually. Horizontal dashed black lines indicate a quiescent zero level. The shaded pink area labels the duration of an exoplanetary transit. The 1σ error for the displayed data points is within the 3−6% range.
Current usage metrics show cumulative count of Article Views (full-text article views including HTML views, PDF and ePub downloads, according to the available data) and Abstracts Views on Vision4Press platform.
Data correspond to usage on the plateform after 2015. The current usage metrics is available 48-96 hours after online publication and is updated daily on week days.
Initial download of the metrics may take a while.