Free Access
Fig. 4
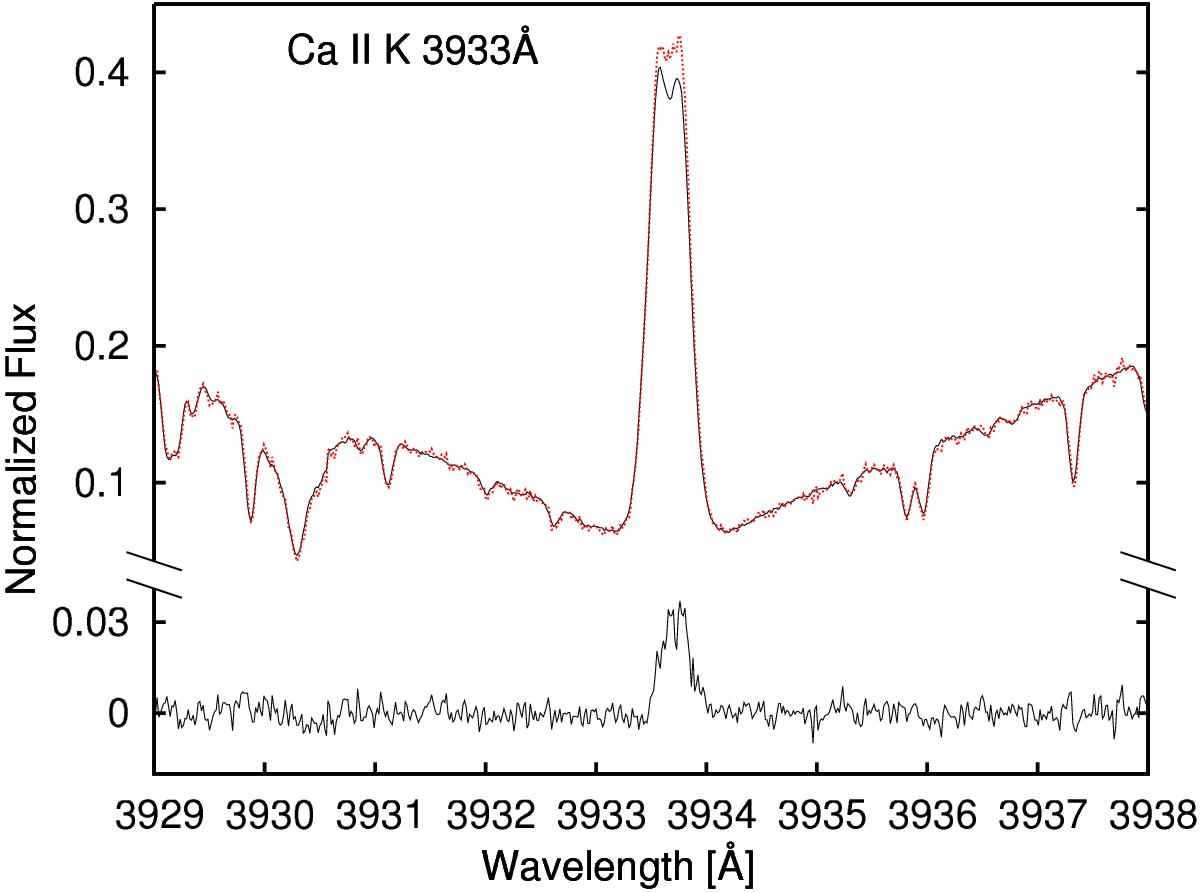
Activity in the core of the Ca ii K line (3933 Å). Upper part: quiescent reference spectrum (solid black line) and spectrum observed during the flare peak (dotted red line). Bottom curve: flux residuals after subtracting the quiescent spectrum from the flare spectrum (solid black line).
Current usage metrics show cumulative count of Article Views (full-text article views including HTML views, PDF and ePub downloads, according to the available data) and Abstracts Views on Vision4Press platform.
Data correspond to usage on the plateform after 2015. The current usage metrics is available 48-96 hours after online publication and is updated daily on week days.
Initial download of the metrics may take a while.