Fig. 3
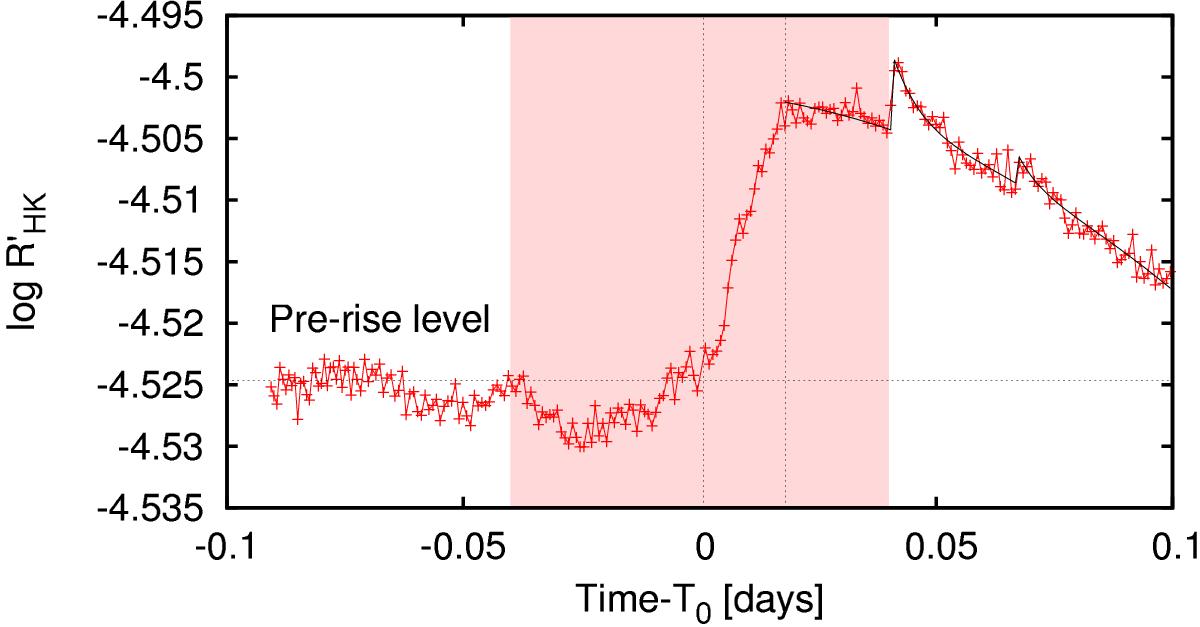
Temporal evolution of the chromospheric activity index ![]() . The primary rise and peak phases (dashed, vertical lines), the adopted pre-flare level (horizontal dashed line), and the best fit of the gradual decay phase along with the secondary and tertiary flares are indicated. The center of the x axis (time = 0 days) corresponds to the middle of the transit (T0 [HJD,UTC] = 2 456 109.26164). The shaded pink area indicates the duration of an exoplanetary transit, the 1σ error for the data points varies between 3−4%.
. The primary rise and peak phases (dashed, vertical lines), the adopted pre-flare level (horizontal dashed line), and the best fit of the gradual decay phase along with the secondary and tertiary flares are indicated. The center of the x axis (time = 0 days) corresponds to the middle of the transit (T0 [HJD,UTC] = 2 456 109.26164). The shaded pink area indicates the duration of an exoplanetary transit, the 1σ error for the data points varies between 3−4%.
Current usage metrics show cumulative count of Article Views (full-text article views including HTML views, PDF and ePub downloads, according to the available data) and Abstracts Views on Vision4Press platform.
Data correspond to usage on the plateform after 2015. The current usage metrics is available 48-96 hours after online publication and is updated daily on week days.
Initial download of the metrics may take a while.