Fig. 1
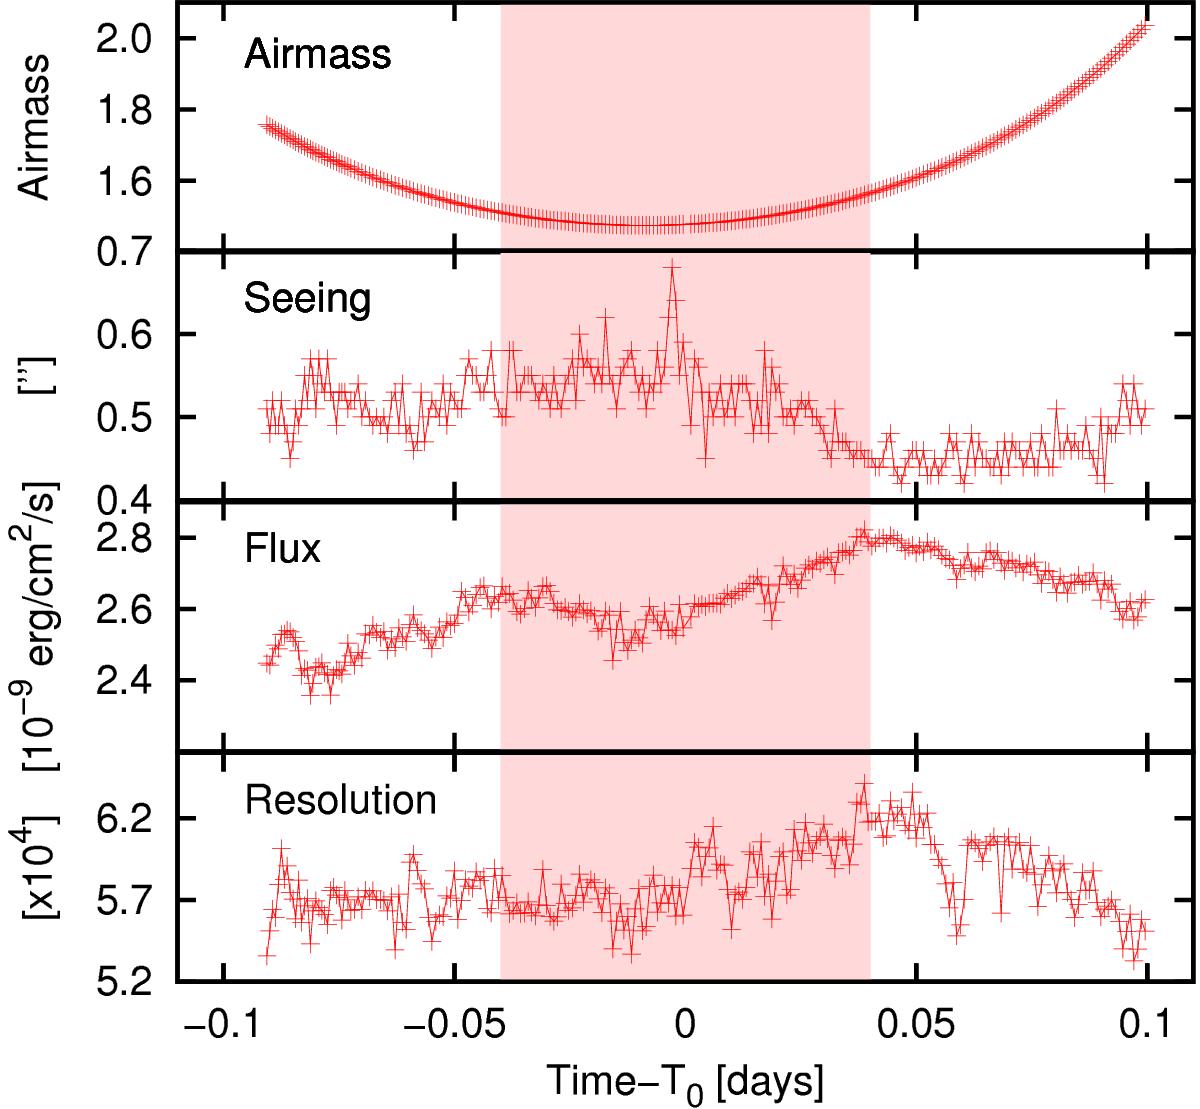
Observing conditions and evolution of spectral resolution. From top to bottom: temporal evolution of the airmass, seeing, spectral flux measured on a blue chip, and instrumental resolution. Red crosses represent single data points. The shaded area indicates the transit duration and the transit mid-time, T0, refers to MJDHJD,UTC = 56 109.26164. This value is used in all the following figures.
Current usage metrics show cumulative count of Article Views (full-text article views including HTML views, PDF and ePub downloads, according to the available data) and Abstracts Views on Vision4Press platform.
Data correspond to usage on the plateform after 2015. The current usage metrics is available 48-96 hours after online publication and is updated daily on week days.
Initial download of the metrics may take a while.