Fig. 7
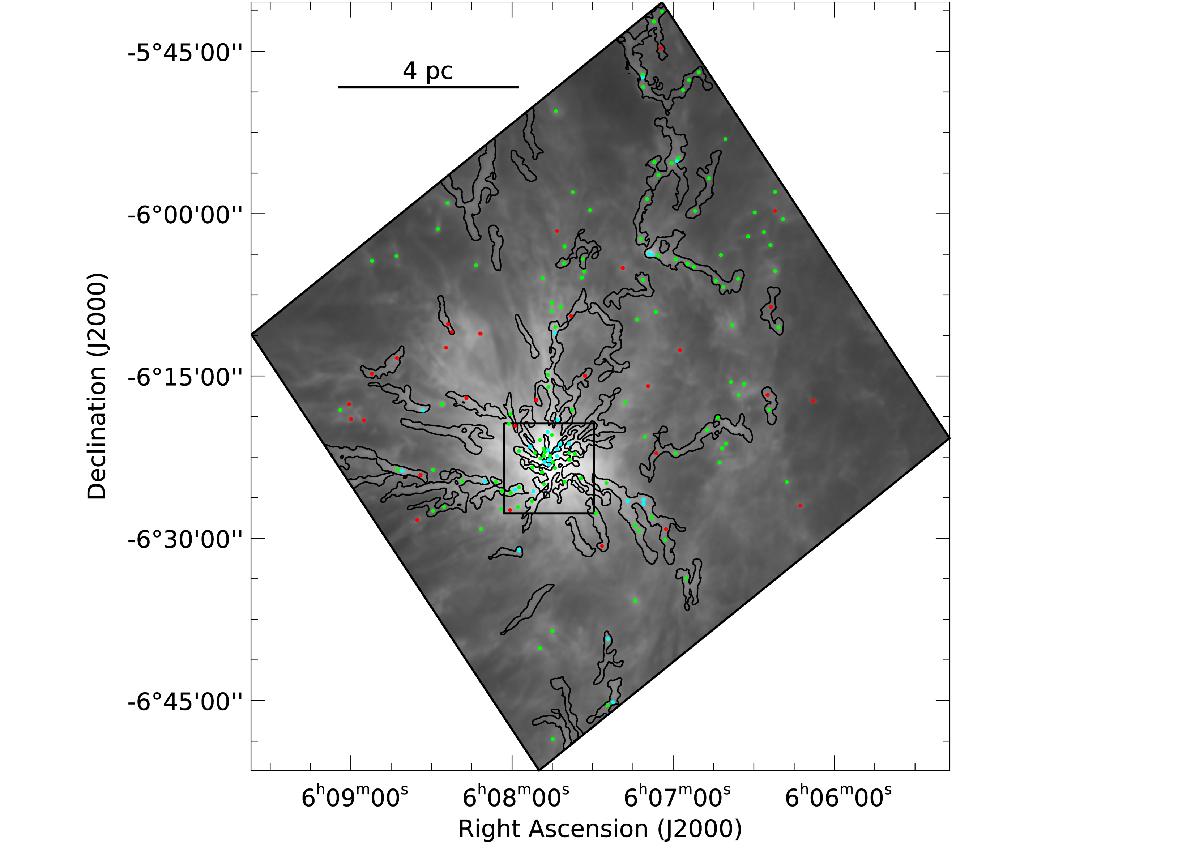
Monoceros R2 sources, on the 250 μm flux map (Fig. A.3). The getfilaments map is overlaid as black contours (strictly, these are the filaments detected on the column density map at scales below 72′′). The contours are those from Fig. 3 (H2 column densities 3 × 1021 cm-2 and 1.5 × 1022 cm-2). A zoom-in of the region in the red box (the central hub) is shown in Fig. 8. The points are protostars (blue), bound cores (green), and unbound clumps (red); see text for details.
Current usage metrics show cumulative count of Article Views (full-text article views including HTML views, PDF and ePub downloads, according to the available data) and Abstracts Views on Vision4Press platform.
Data correspond to usage on the plateform after 2015. The current usage metrics is available 48-96 hours after online publication and is updated daily on week days.
Initial download of the metrics may take a while.