Free Access
Fig. 6
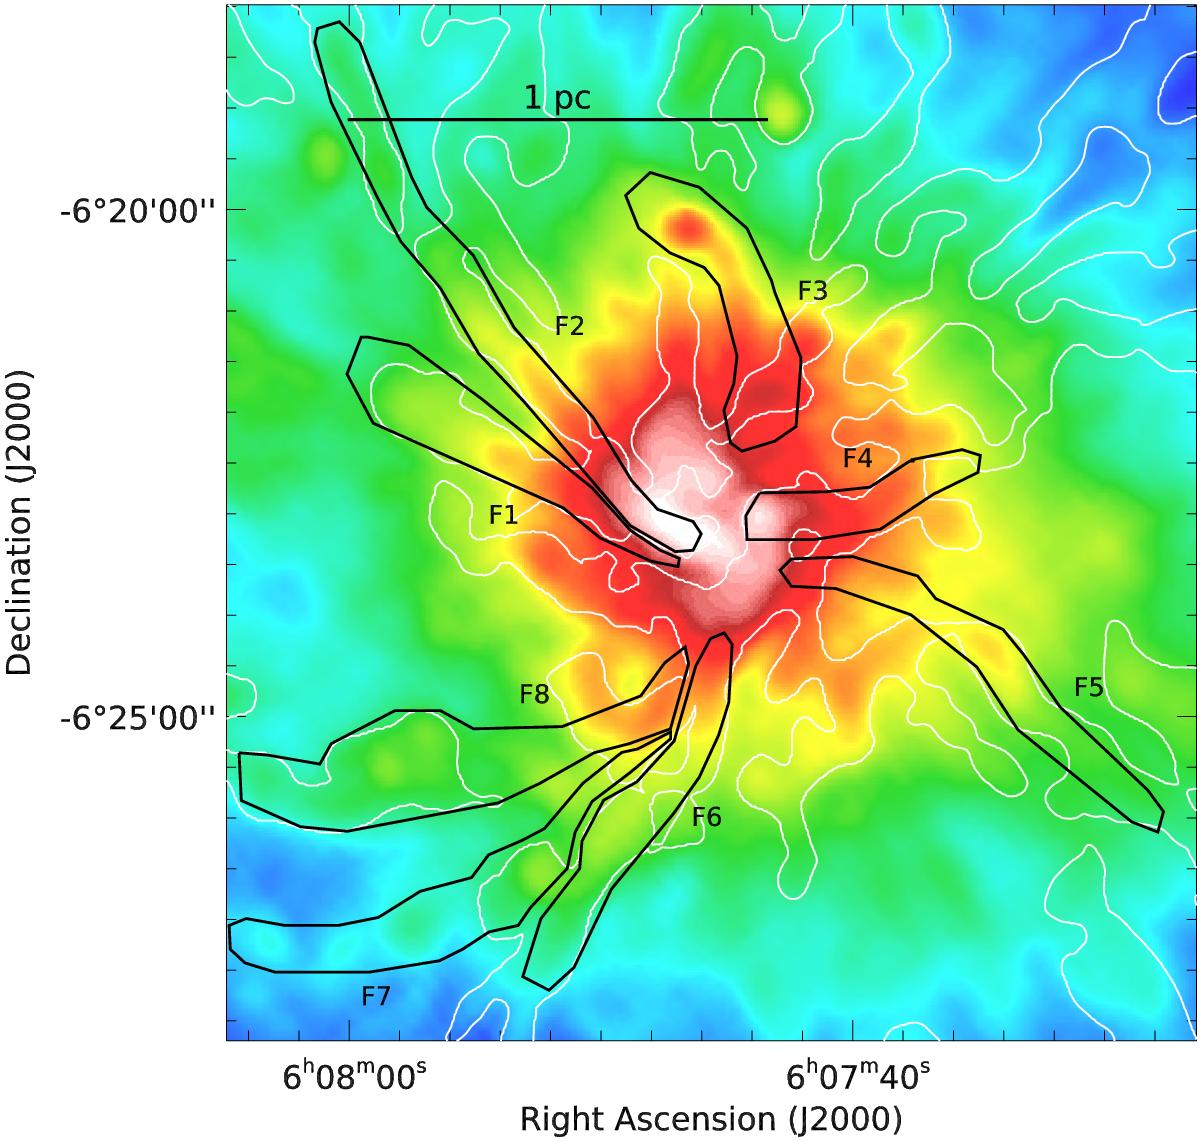
Colour map of the Herschel column density (Fig. 3), overlaid with polygons (F1–F8) indicating the areas over which the filament properties (average column density, density, temperature, and total mass) were determined. The white contours show the filaments identified by getsources in the column density map.
Current usage metrics show cumulative count of Article Views (full-text article views including HTML views, PDF and ePub downloads, according to the available data) and Abstracts Views on Vision4Press platform.
Data correspond to usage on the plateform after 2015. The current usage metrics is available 48-96 hours after online publication and is updated daily on week days.
Initial download of the metrics may take a while.