Free Access
Fig. 5
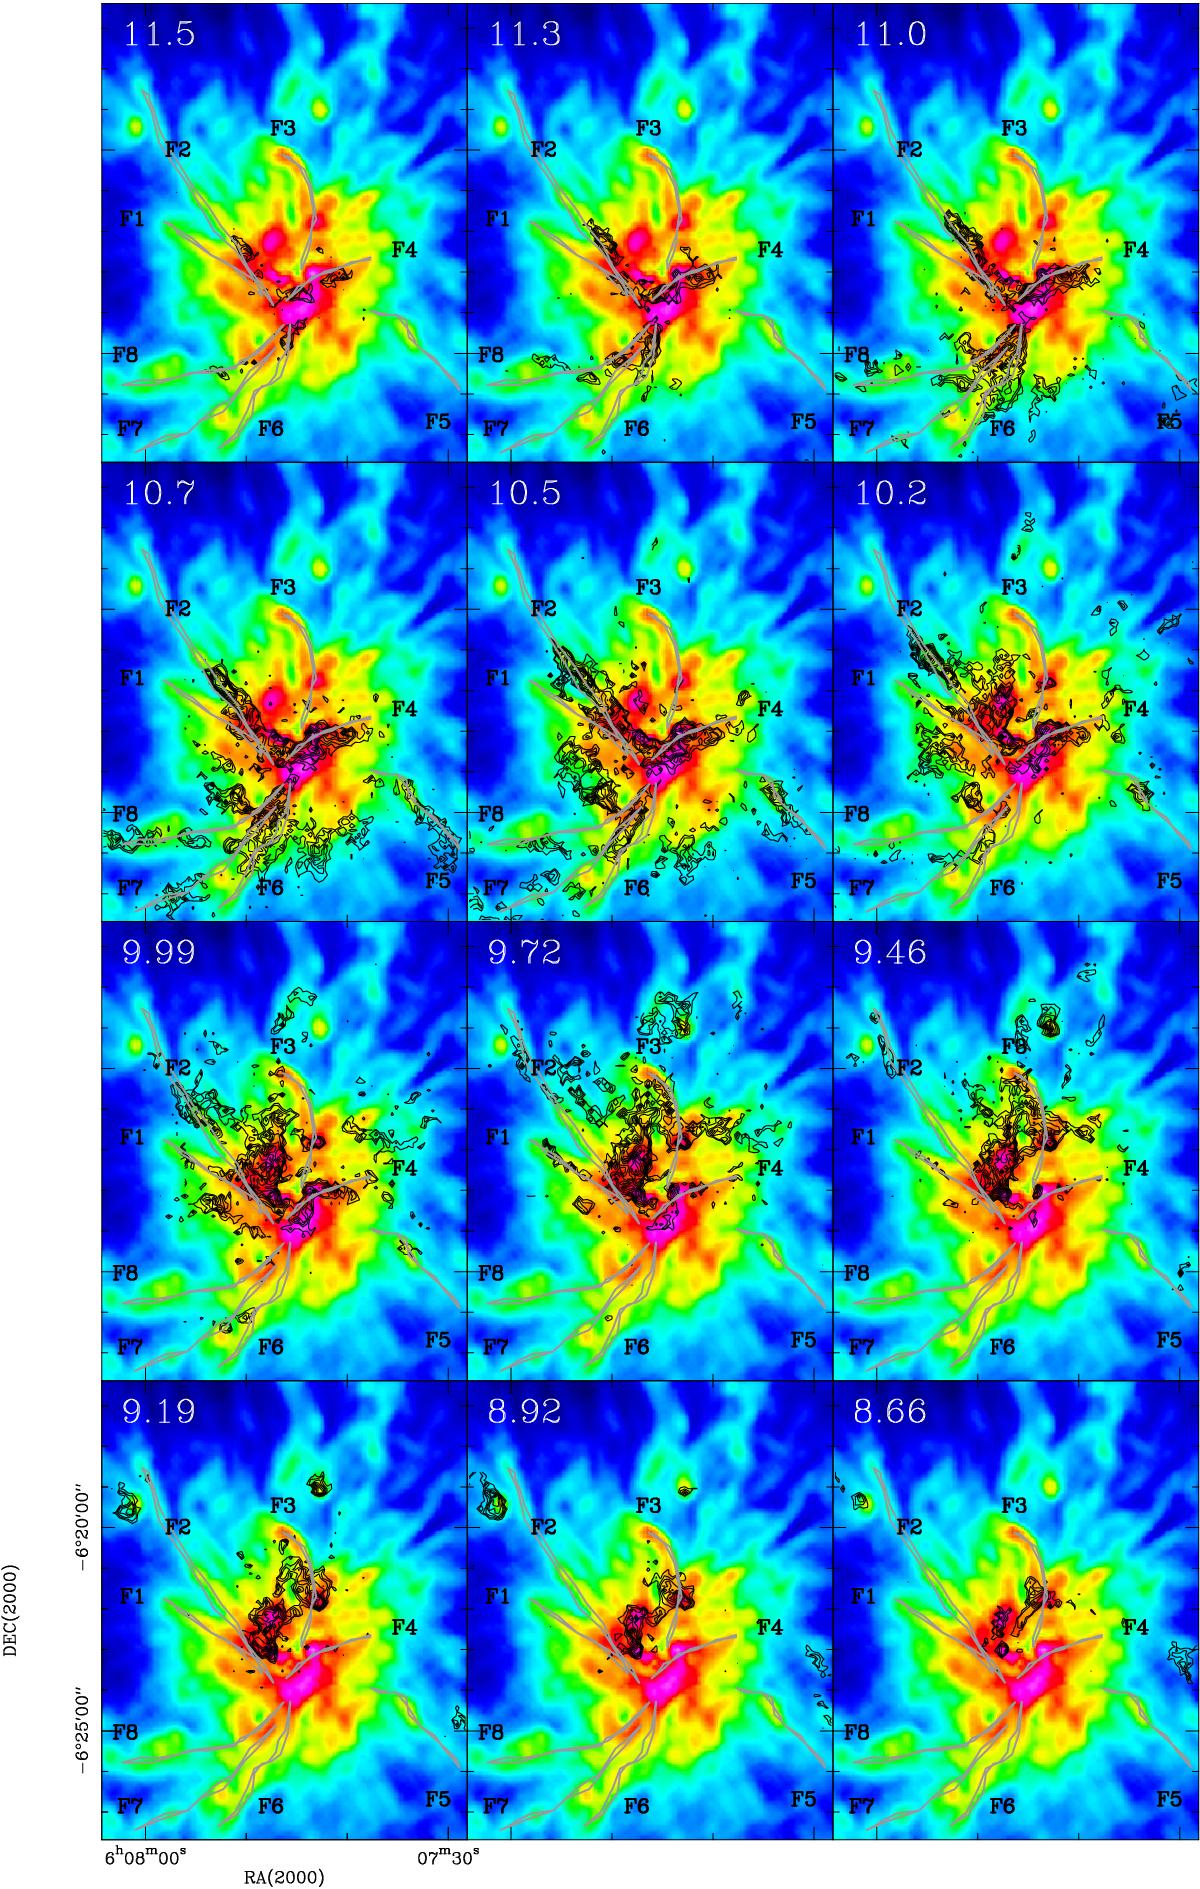
Channel map of C18O 2 → 1 emission. Black contours (2.5–7 K km s-1 by 0.5 K km s-1) are overlaid on the Herschel column density map in colour (Fig. 3). Filaments identified in the C18O and in the Herschel map are classified F1–F8 and traced in grey.
Current usage metrics show cumulative count of Article Views (full-text article views including HTML views, PDF and ePub downloads, according to the available data) and Abstracts Views on Vision4Press platform.
Data correspond to usage on the plateform after 2015. The current usage metrics is available 48-96 hours after online publication and is updated daily on week days.
Initial download of the metrics may take a while.