Fig. D.2
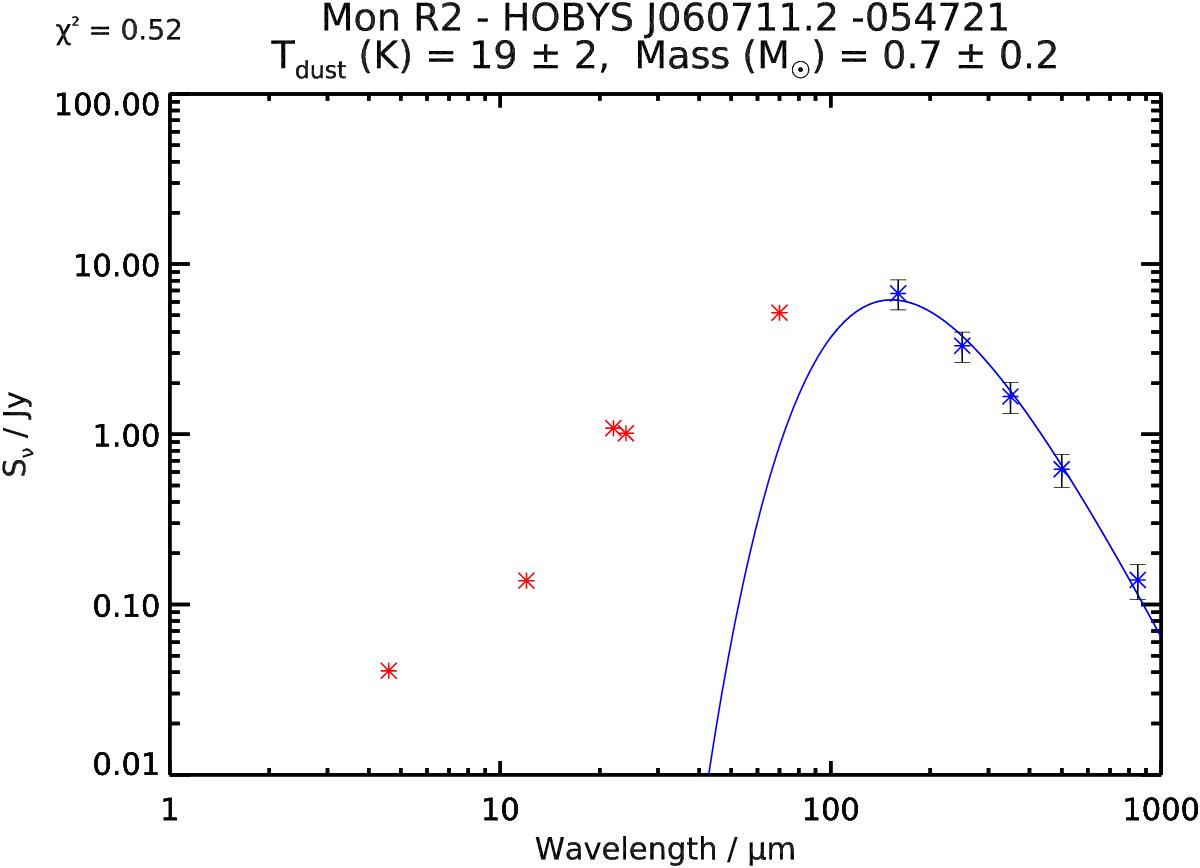
SED of a probable protostellar core in the Monoceros R2 region. Blue crosses represent reliable data points; red crosses represent short-wavelength data points used only for luminosity calculations (while not present here, some SEDs within the catalogue also show red crosses, albeit with long error-bars, which represent unreliable data points, which are used for SED fitting, but with greatly increased errors). The χ2 value of the fit is given at the upper left of the plot. The snapshots of this source are given in Fig. D.1. We note that the fluxes are those used for the SED calculation, and have thus been modified using flux scaling.
Current usage metrics show cumulative count of Article Views (full-text article views including HTML views, PDF and ePub downloads, according to the available data) and Abstracts Views on Vision4Press platform.
Data correspond to usage on the plateform after 2015. The current usage metrics is available 48-96 hours after online publication and is updated daily on week days.
Initial download of the metrics may take a while.