Fig. D.1
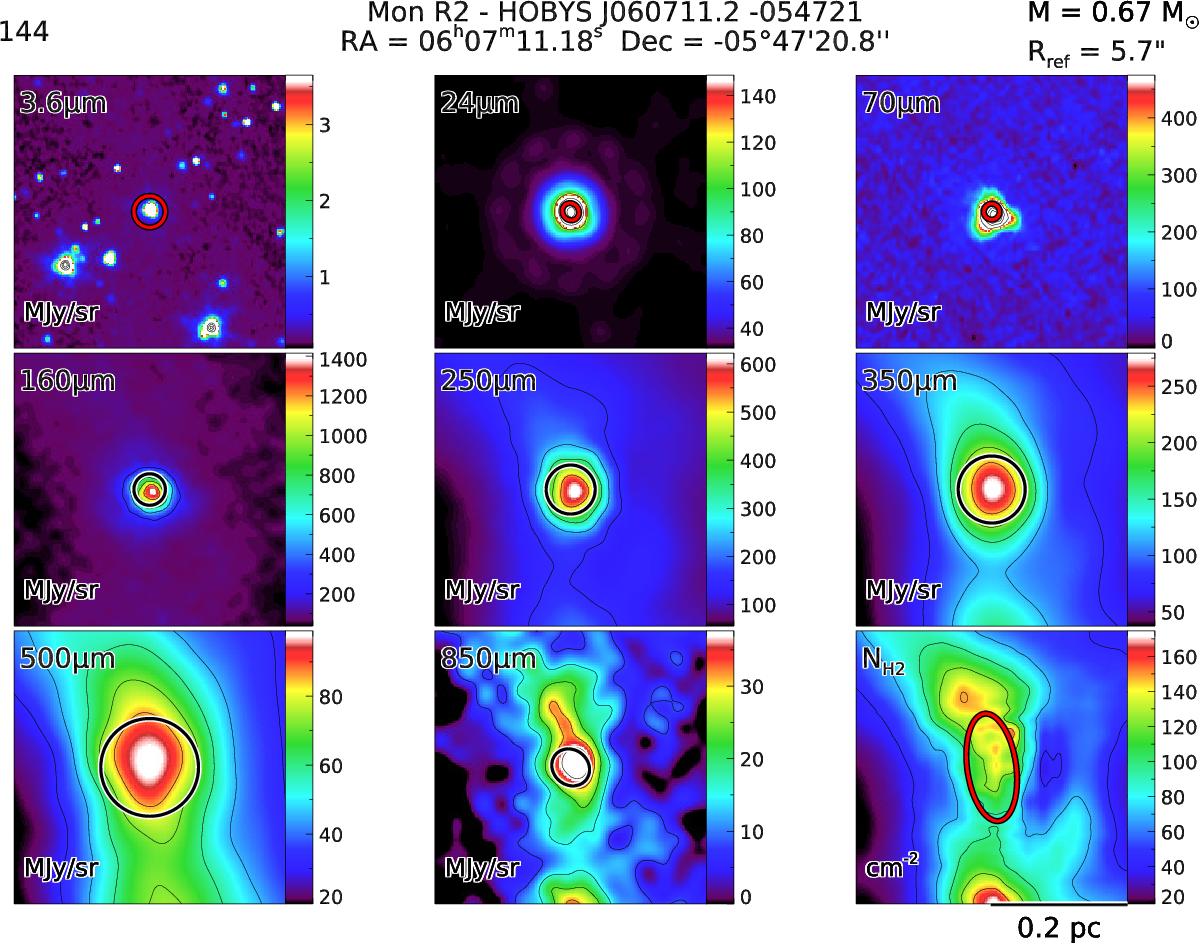
Images of a probable protostellar core in the Monoceros R2 region at 3.6 μm (IRAC), 24 μm (MIPS), 70 μm, 160 μm (PACS), 250 μm, 350 μm, 500 μm (SPIRE), 850 μm (SCUBA-2) and in the high-resolution column density map (source HOBYS J060711.2 −054721; number 144 in the full catalogue). All images cover the same spatial scale (approximately 100′′ × 100′′, or 0.4 pc × 0.4 pc); this is for consistency across all sources, some of which are much larger than HOBYS J060711.2 −054721. The ellipses show the extent of the source FWHM (assuming a 2d Gaussian shape) as determined by getsources for each individual wavelength. A black ellipse indicates that the detection at this wavelength was either considered reliable (160–850 μm), or was a 70 μm detection used for the SED fit. (The ellipse shown at 3.6 μm is the ellipse measured at the reference wavelength; here 160 μm.) The source mass and angular size at the reference wavelength are given at the upper right of the snapshots. We note that only one set of snapshots is included here; the full catalogue will contain snapshots for all robust sources. The SED of this source is given in Fig. D.2.
Current usage metrics show cumulative count of Article Views (full-text article views including HTML views, PDF and ePub downloads, according to the available data) and Abstracts Views on Vision4Press platform.
Data correspond to usage on the plateform after 2015. The current usage metrics is available 48-96 hours after online publication and is updated daily on week days.
Initial download of the metrics may take a while.