Fig. 2
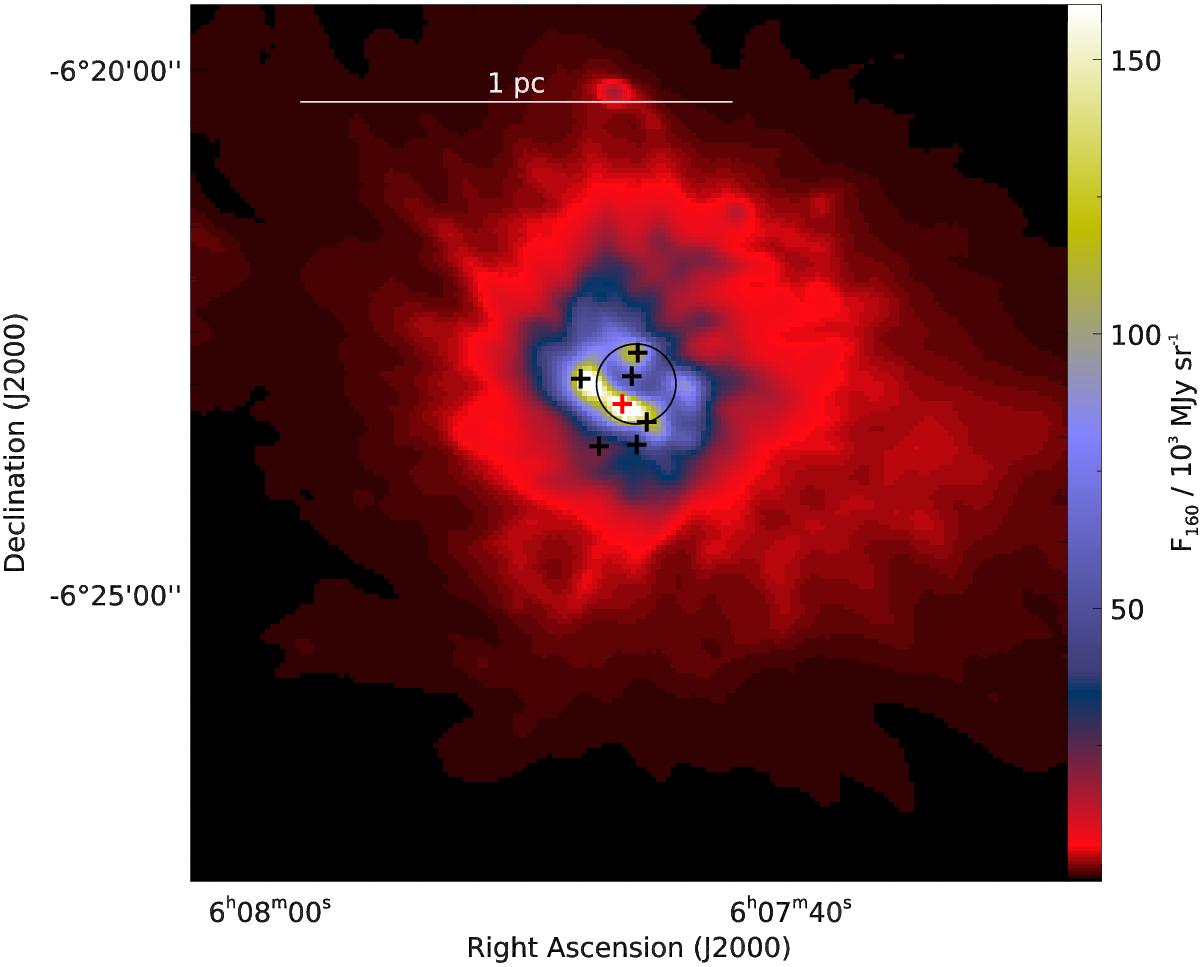
Monoceros R2 central hub region as seen at 160 μm. The region viewed is shown as the black box in Fig. 1. The black circle shows the approximate position and extent of the H ii region (Pilleri et al. 2012; Didelon et al. 2015). The sources are from Beckwith et al. (1976), detected between 1.65 μm and 20 μm (the red object is Mon R2 IRS 1).
Current usage metrics show cumulative count of Article Views (full-text article views including HTML views, PDF and ePub downloads, according to the available data) and Abstracts Views on Vision4Press platform.
Data correspond to usage on the plateform after 2015. The current usage metrics is available 48-96 hours after online publication and is updated daily on week days.
Initial download of the metrics may take a while.