Fig. 1
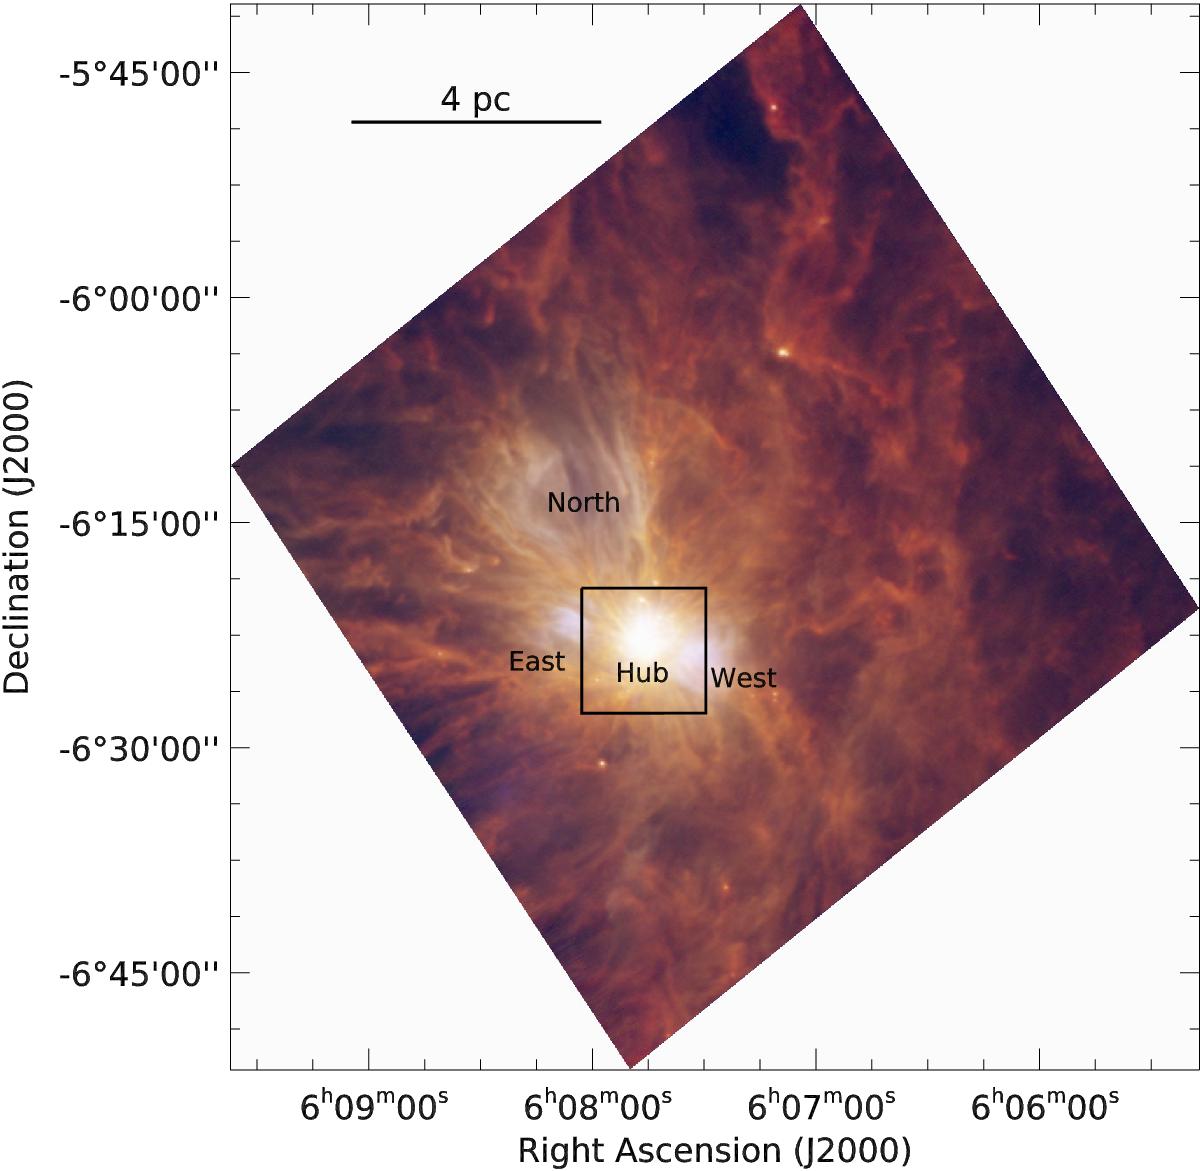
Monoceros R2 as viewed by Herschel: PACS 70 μm in blue; PACS 160 μm in green; and SPIRE 250 μm in red. The image is cropped to the approximate overlap between the PACS and SPIRE maps. The black box indicates the central hub, which is shown in more detail in Fig. 2 (due to the large range in brightness, the detailed features of the central hub do not appear clearly in this three-colour image). The positions of the hub itself, and the three surrounding H ii regions are also given. The three maps are given separately (with intensity scales) in Appendix A.
Current usage metrics show cumulative count of Article Views (full-text article views including HTML views, PDF and ePub downloads, according to the available data) and Abstracts Views on Vision4Press platform.
Data correspond to usage on the plateform after 2015. The current usage metrics is available 48-96 hours after online publication and is updated daily on week days.
Initial download of the metrics may take a while.