Fig. 7
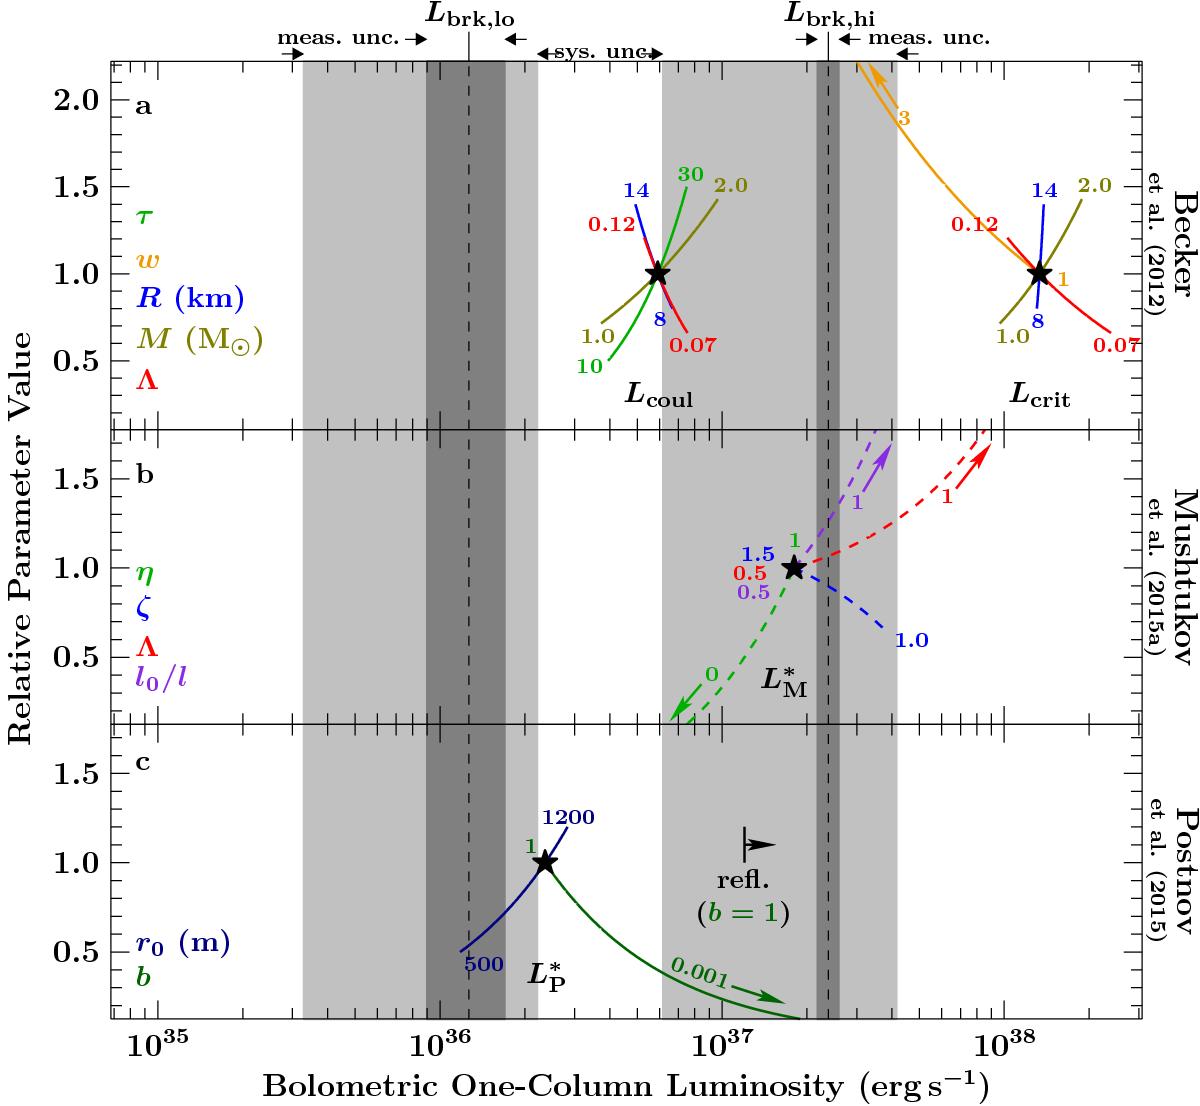
Comparison of the derived luminosities at the breaks of the spectral evolution (Lbrk,lo and Lbrk,hi, vertical dashed lines) with Lcoul and Lcrit of Becker et al. (2012, Eqs. (A.1A.2panel a, ![]() of Mushtukov et al. (2015a, Eq. (A.3b, and
of Mushtukov et al. (2015a, Eq. (A.3b, and ![]() of Postnov et al. (2015a, Eq. (A.4c. The dark gray bands correspond to the 90% statistical uncertainties of the measured break fluxes (meas. unc). The larger widths in light gray are the uncertainties when deriving luminosities from the observed fluxes as described in the text (sys. unc.). The black stars are the theoretically expected values for typical neutron star parameters and Ecyc as found by NuSTAR and corrected for the gravitational redshift. The colored lines represent changes in the neutron star parameters with their relative value along the y-axis. The minimum and maximum absolute values are marked at the line endings. The black arrow in panel (c) marks the luminosity above which Postnov et al. (2015a) expect reflected radiation from the neutron star’s surface to contribute significantly. The dependencies of the parameters in panel (b) (dashed lines) are assumed to be linear (see text for details).
of Postnov et al. (2015a, Eq. (A.4c. The dark gray bands correspond to the 90% statistical uncertainties of the measured break fluxes (meas. unc). The larger widths in light gray are the uncertainties when deriving luminosities from the observed fluxes as described in the text (sys. unc.). The black stars are the theoretically expected values for typical neutron star parameters and Ecyc as found by NuSTAR and corrected for the gravitational redshift. The colored lines represent changes in the neutron star parameters with their relative value along the y-axis. The minimum and maximum absolute values are marked at the line endings. The black arrow in panel (c) marks the luminosity above which Postnov et al. (2015a) expect reflected radiation from the neutron star’s surface to contribute significantly. The dependencies of the parameters in panel (b) (dashed lines) are assumed to be linear (see text for details).
Current usage metrics show cumulative count of Article Views (full-text article views including HTML views, PDF and ePub downloads, according to the available data) and Abstracts Views on Vision4Press platform.
Data correspond to usage on the plateform after 2015. The current usage metrics is available 48-96 hours after online publication and is updated daily on week days.
Initial download of the metrics may take a while.