Fig. 5
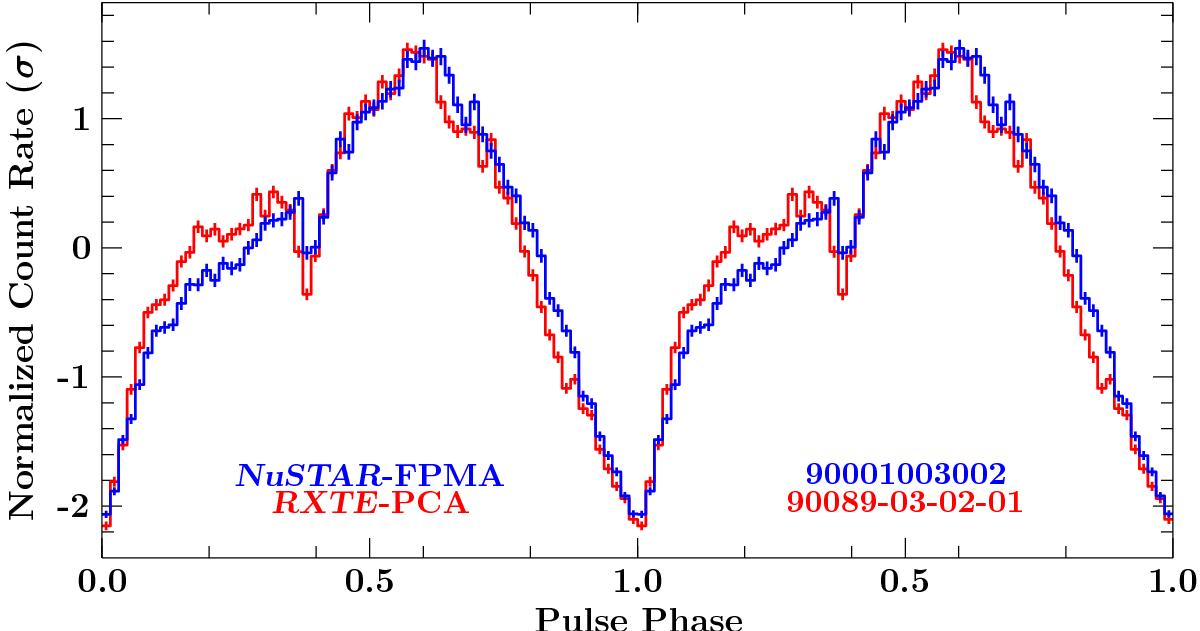
Pulse profiles of GRO J1008−57 during epoch 3 (blue; NuSTAR-FPMA) and 2005 (red; RXTE-PCA). The RXTE observation was performed at a similar flux level of the source compared to the NuSTAR observation. The pulse profiles have been normalized to a mean count rate of zero and a standard deviation, σ, of unity. Pulse phase zero is defined as the minimum count rate.
Current usage metrics show cumulative count of Article Views (full-text article views including HTML views, PDF and ePub downloads, according to the available data) and Abstracts Views on Vision4Press platform.
Data correspond to usage on the plateform after 2015. The current usage metrics is available 48-96 hours after online publication and is updated daily on week days.
Initial download of the metrics may take a while.