Fig. 3
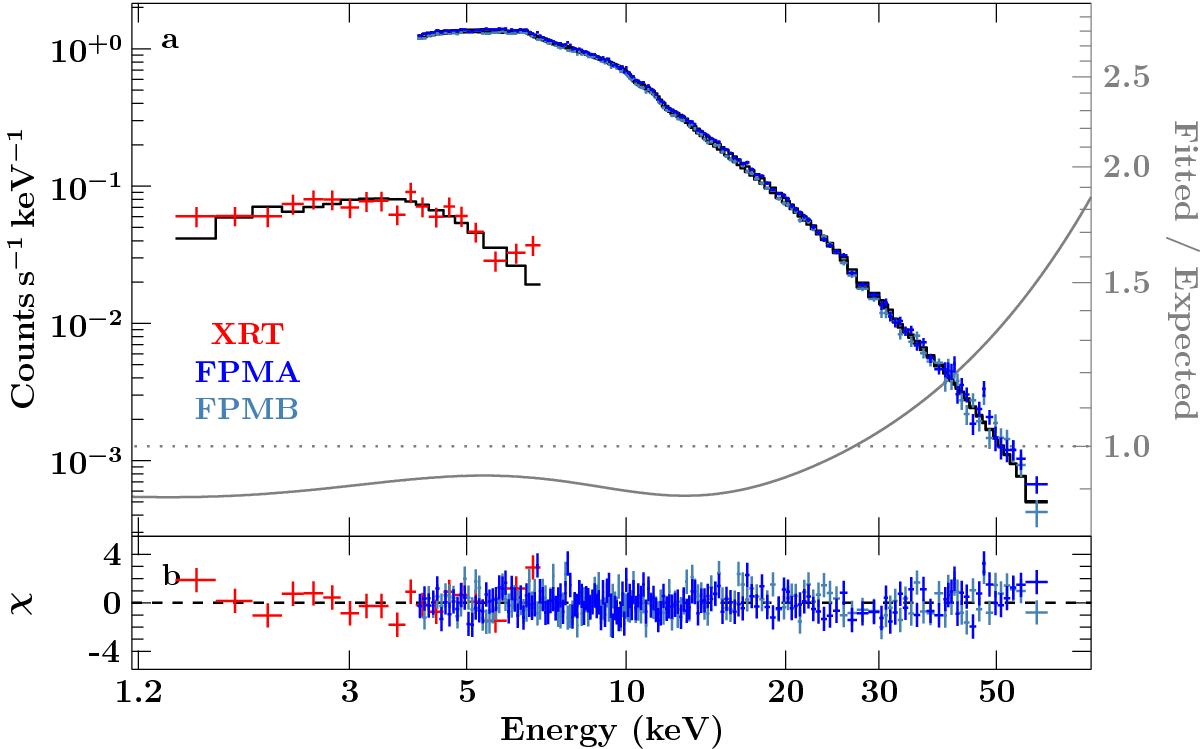
a) NuSTAR-FPMA (dark blue), -FPMB (light blue), and Swift-XRT spectrum (red) of GRO J1008−57 in 2014 December after the second peak of its triple peaked outburst (epoch 3). The best-fit model is shown in black and the gray line shows its ratio to the spectral shape as predicted by our spectral evolution model (see Sect. 5 and Fig. 6). The data have been rebinned for display purposes. b) The residuals of the best-fit model.
Current usage metrics show cumulative count of Article Views (full-text article views including HTML views, PDF and ePub downloads, according to the available data) and Abstracts Views on Vision4Press platform.
Data correspond to usage on the plateform after 2015. The current usage metrics is available 48-96 hours after online publication and is updated daily on week days.
Initial download of the metrics may take a while.