Fig. 2
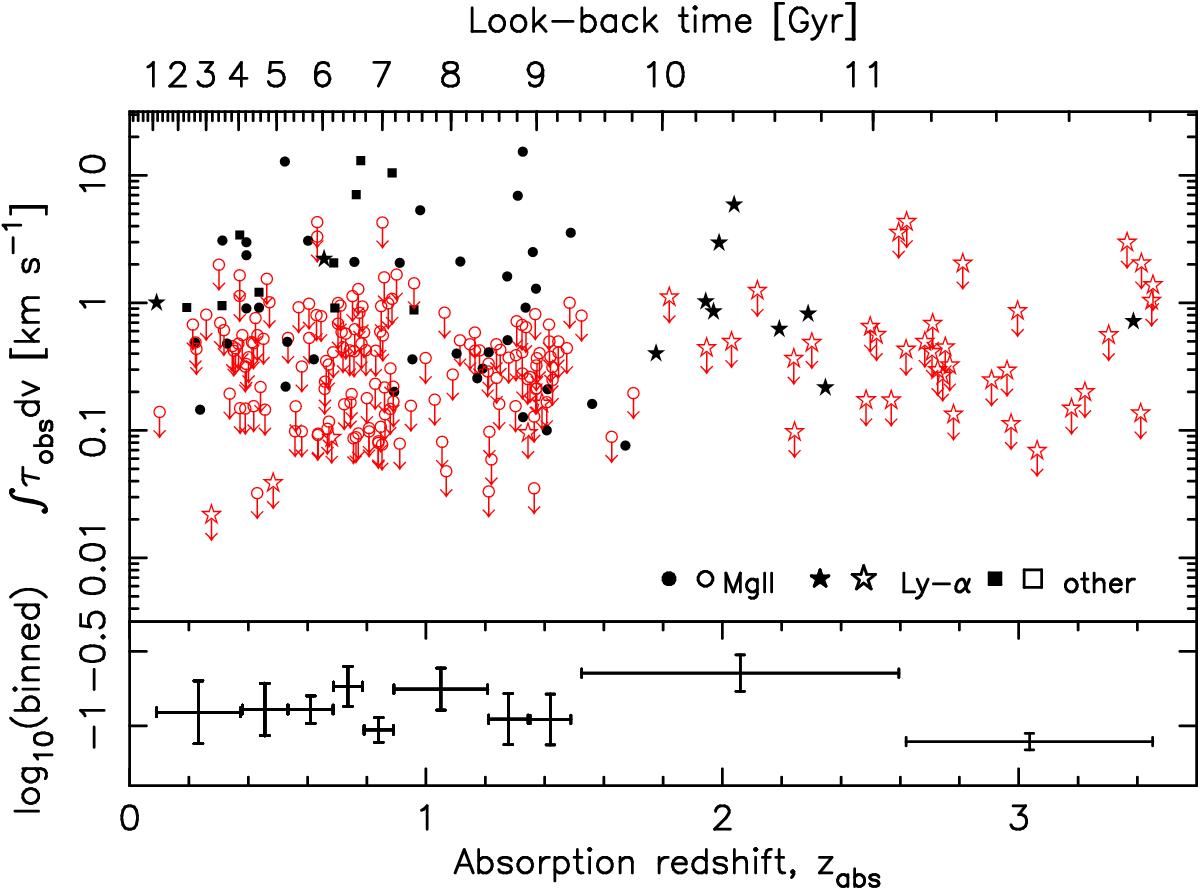
Velocity integrated optical depth versus the redshift for the intervening absorbers searched in H i 21-cm. The filled symbols show the detections and the unfilled circles the 3σ upper limits, with the shape representing the transition in which the absorption was initially detected: circles – Mg ii, stars – Lyman-α, squares – other (e.g. 21-cm scan). The bottom panel shows the binned values in equally sized bins (10 bins of 25), including the limits, where the horizontal error bars show the range of points in the bin and the vertical error bars the 1σ uncertainty in the mean value.
Current usage metrics show cumulative count of Article Views (full-text article views including HTML views, PDF and ePub downloads, according to the available data) and Abstracts Views on Vision4Press platform.
Data correspond to usage on the plateform after 2015. The current usage metrics is available 48-96 hours after online publication and is updated daily on week days.
Initial download of the metrics may take a while.