Fig. 15
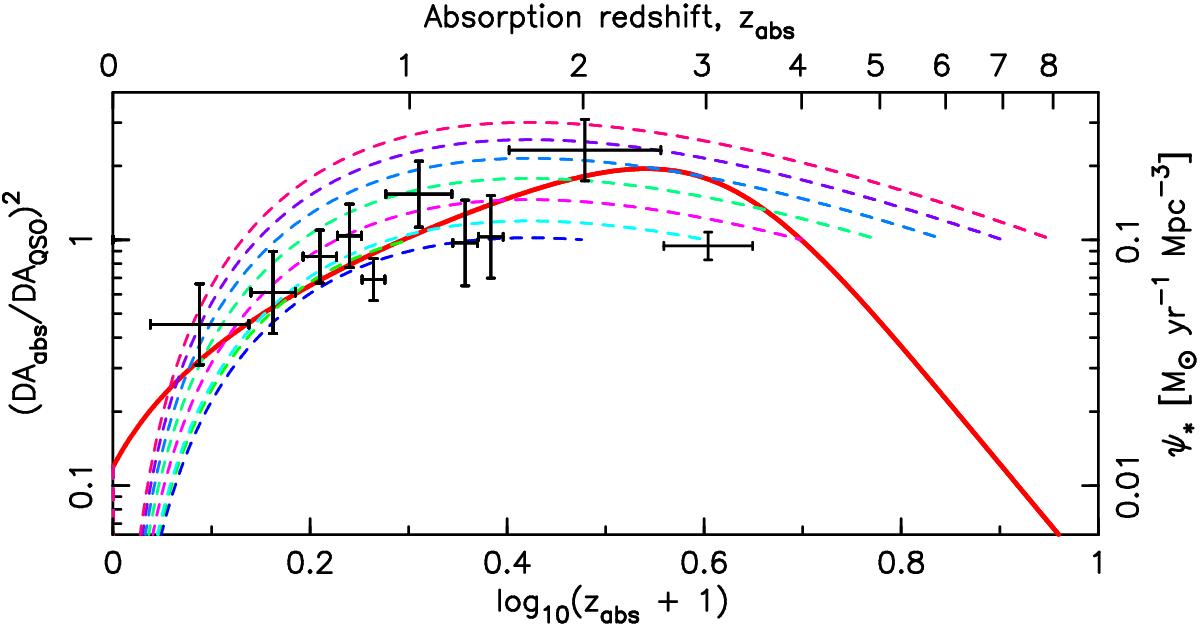
Star formation evolution (solid curve) and (1 /Tspin)(dabs/dQSO)2 (error bars, scaled by a factor of 450, Sect. 3.2) superimposed upon the ratio of angular diameter distances for various QSO redshifts (broken curves). These are shown for zQSO = 1,2,...,8 where the QSO redshift is given by the terminating value of the curve showing the absorption redshift distribution of (DAabs/DAQSO)2.
Current usage metrics show cumulative count of Article Views (full-text article views including HTML views, PDF and ePub downloads, according to the available data) and Abstracts Views on Vision4Press platform.
Data correspond to usage on the plateform after 2015. The current usage metrics is available 48-96 hours after online publication and is updated daily on week days.
Initial download of the metrics may take a while.