Free Access
Fig. 5
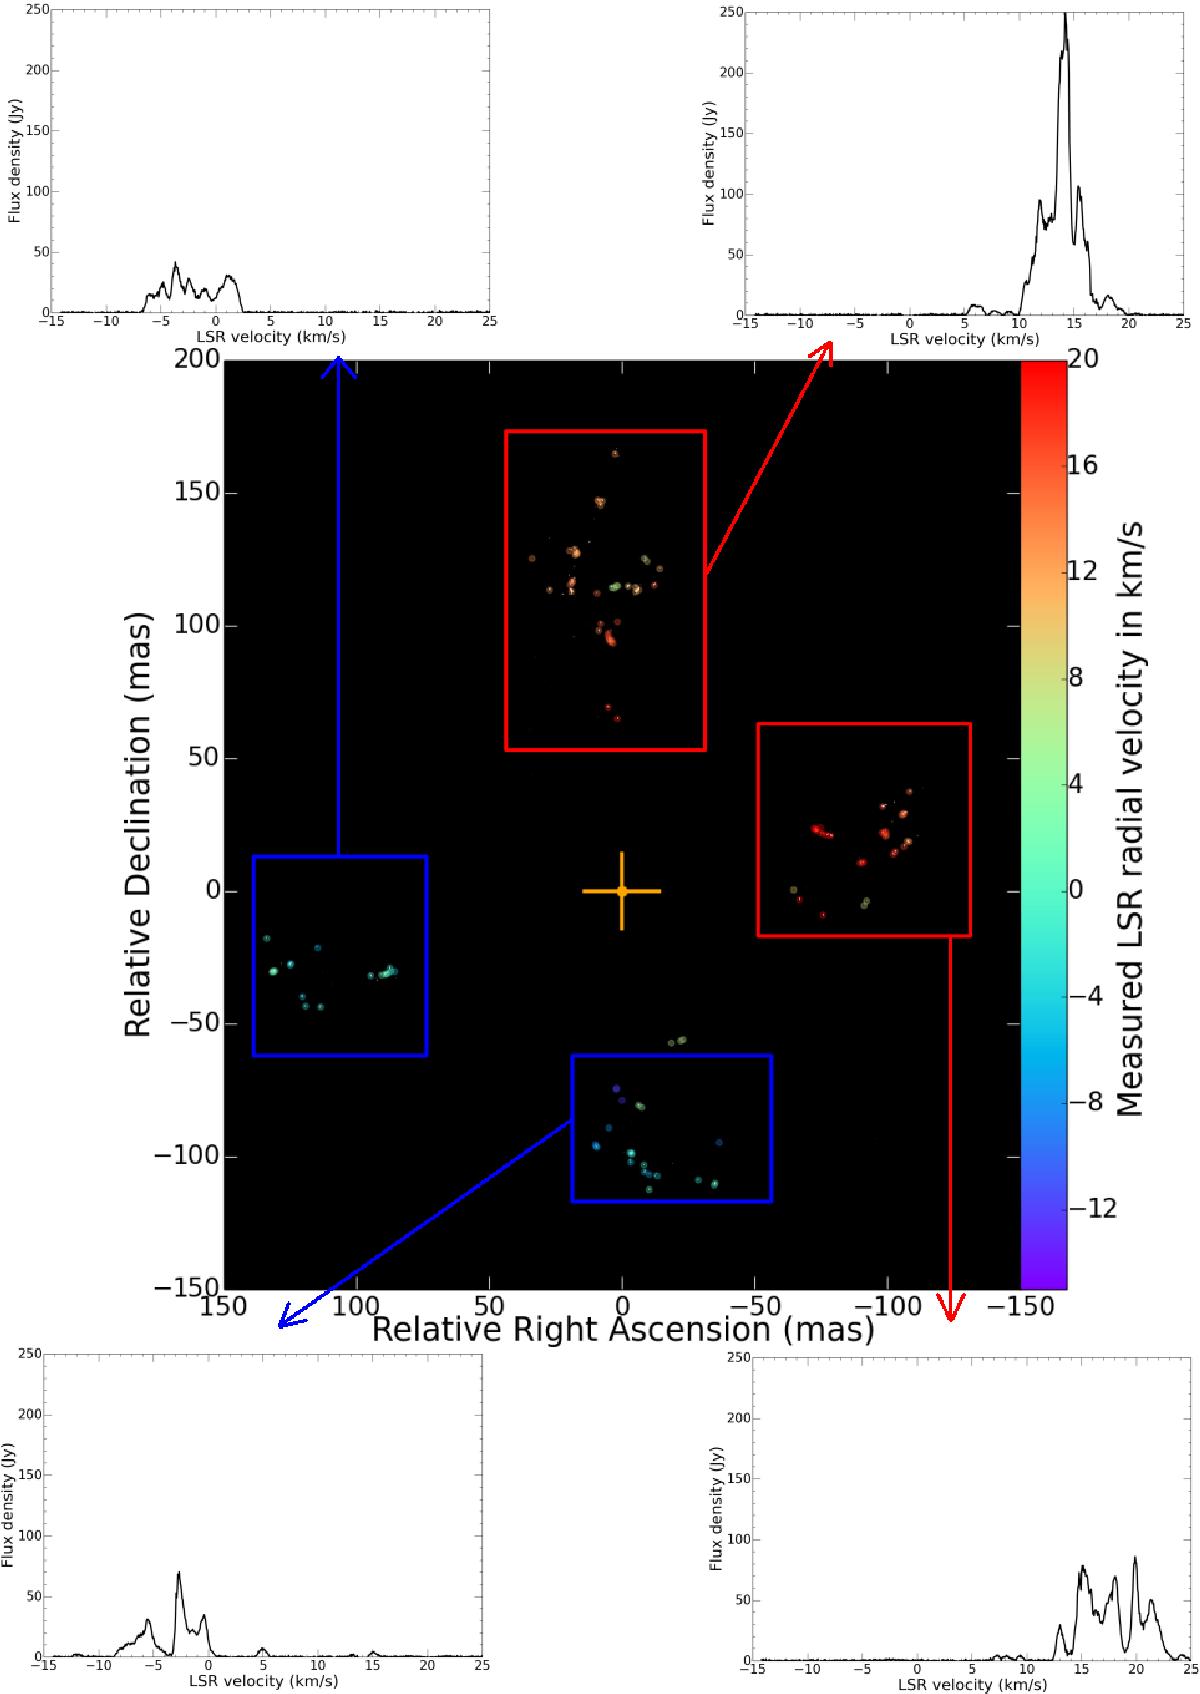
Positions and velocities of individual maser features of the 28SiO v = 1, J = 2−1 maser emission around Source I observed on January 24, 2011. Spectra corresponding to delimited regions on the map are included, per individual arm of the emission structure.
Current usage metrics show cumulative count of Article Views (full-text article views including HTML views, PDF and ePub downloads, according to the available data) and Abstracts Views on Vision4Press platform.
Data correspond to usage on the plateform after 2015. The current usage metrics is available 48-96 hours after online publication and is updated daily on week days.
Initial download of the metrics may take a while.