Fig. 4
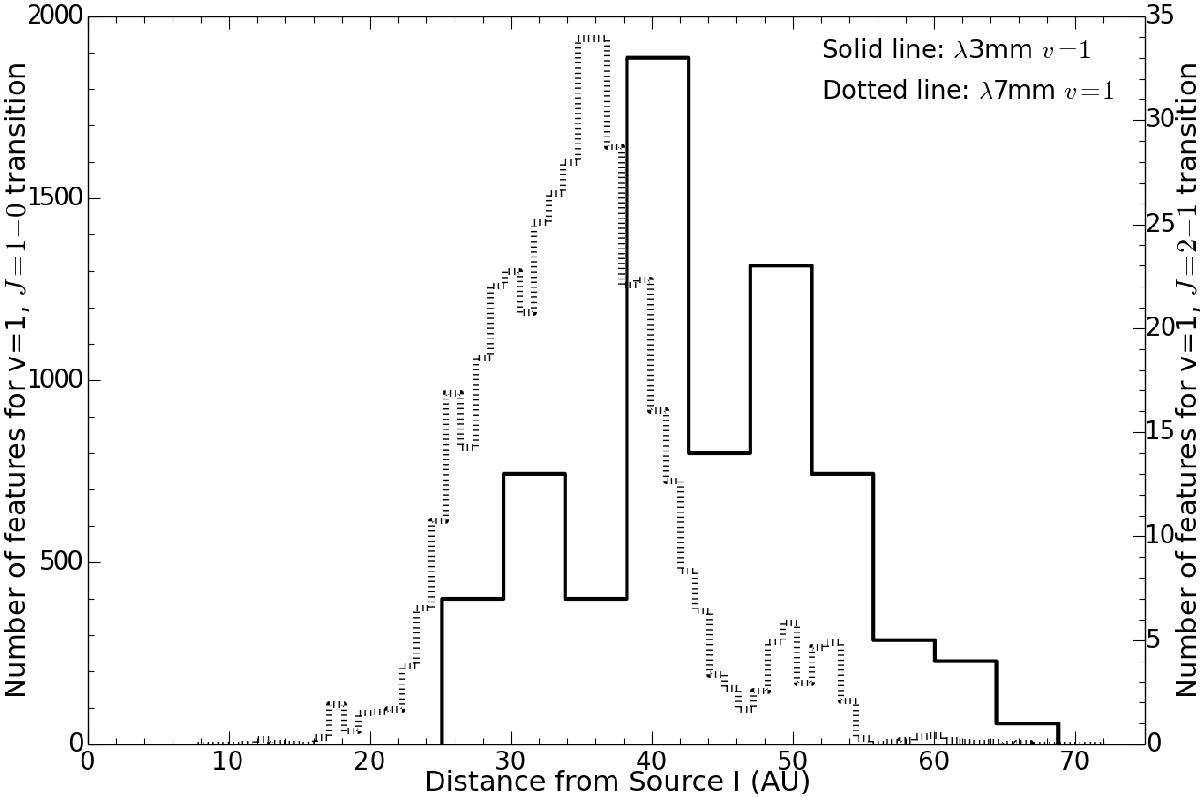
Histograms showing the total number of individual maser features observed in the λ3 mm v = 1, J = 2−1 (January 24, 2011) and λ7 mm v = 1, J = 1−0 (all 19 epochs; Matthews et al. 2010) emission and their positions relative to Source I. The histogram bin width is 1 AU for λ7 mm, and 5 AU for λ3 mm due to the low number of features.
Current usage metrics show cumulative count of Article Views (full-text article views including HTML views, PDF and ePub downloads, according to the available data) and Abstracts Views on Vision4Press platform.
Data correspond to usage on the plateform after 2015. The current usage metrics is available 48-96 hours after online publication and is updated daily on week days.
Initial download of the metrics may take a while.