Fig. 3
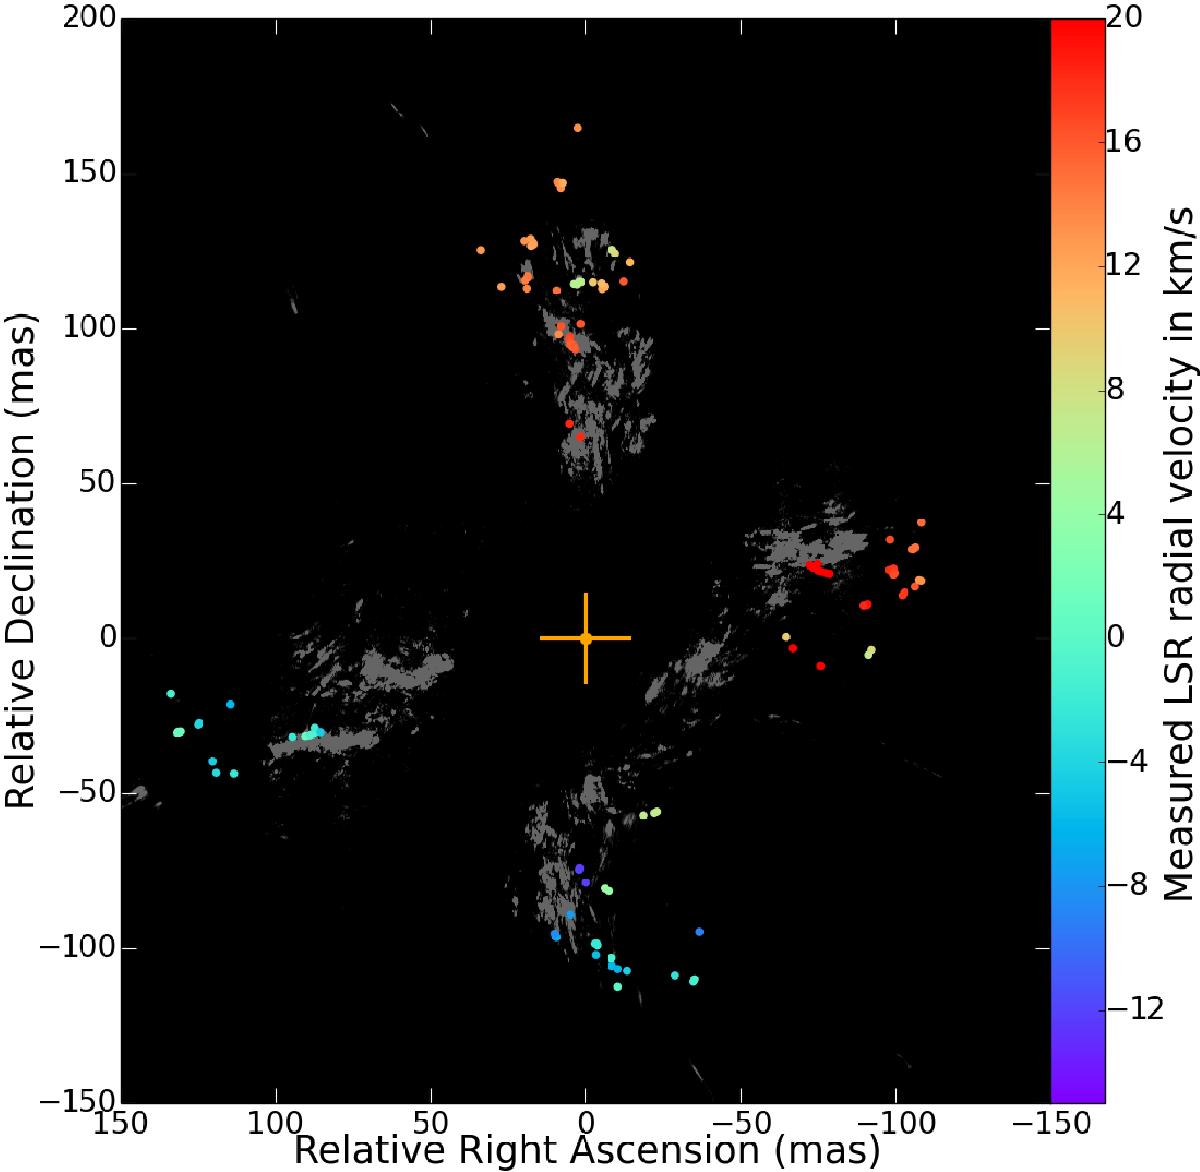
Gaussian-fitted positions and velocities of individual maser features of the 28SiO v = 1, J = 2−1 emission, overlaid on the velocity-integrated intensity map of the λ7 mm emission (all 19 epochs of data spanning 22 months, in grey-scale; Matthews et al. 2010). The cross indicates the estimated position for Source I. Weak λ3 mm emission not visible in Fig. 1 was recovered in the north and south arms and west of the base of the south arm.
Current usage metrics show cumulative count of Article Views (full-text article views including HTML views, PDF and ePub downloads, according to the available data) and Abstracts Views on Vision4Press platform.
Data correspond to usage on the plateform after 2015. The current usage metrics is available 48-96 hours after online publication and is updated daily on week days.
Initial download of the metrics may take a while.