Fig. 2
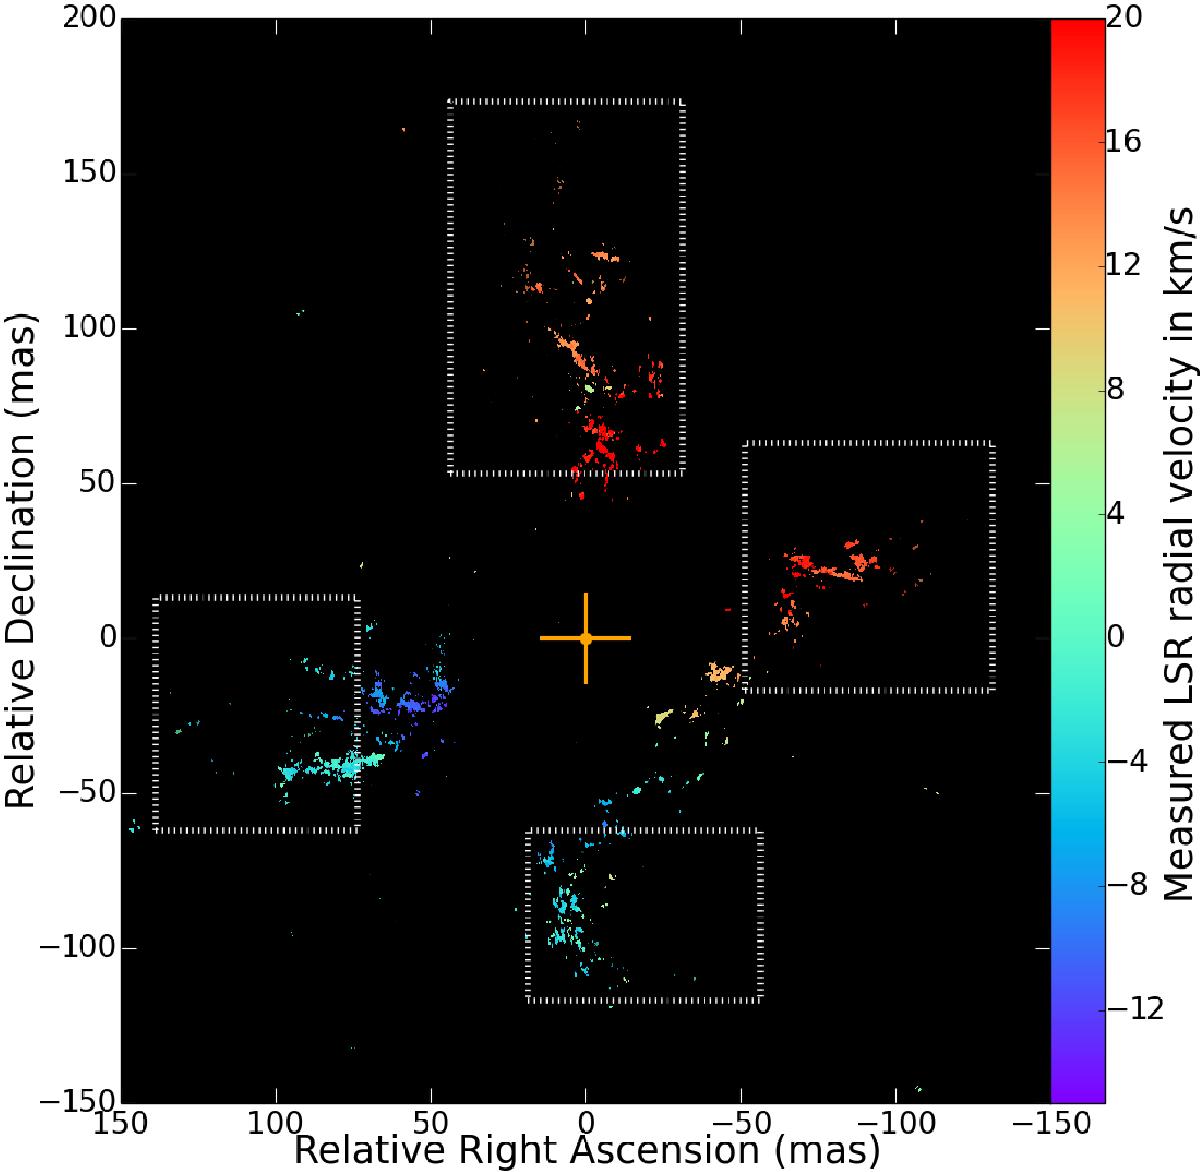
Overlays of the velocity field images of the λ3 mm 28SiO v = 1, J = 2−1 emission of January 24, 2011 and both the λ7 mm 28SiO v = 1, J = 1−0 and v = 2, J = 1−0 maser emission of October 7, 2002. The same color scale is used for both wavelengths, and the velocity fields seem continuous and consistent with each other. The cross indicates the estimated position for Source I. The white boxes delimit the extent of the λ3 mm emission.
Current usage metrics show cumulative count of Article Views (full-text article views including HTML views, PDF and ePub downloads, according to the available data) and Abstracts Views on Vision4Press platform.
Data correspond to usage on the plateform after 2015. The current usage metrics is available 48-96 hours after online publication and is updated daily on week days.
Initial download of the metrics may take a while.