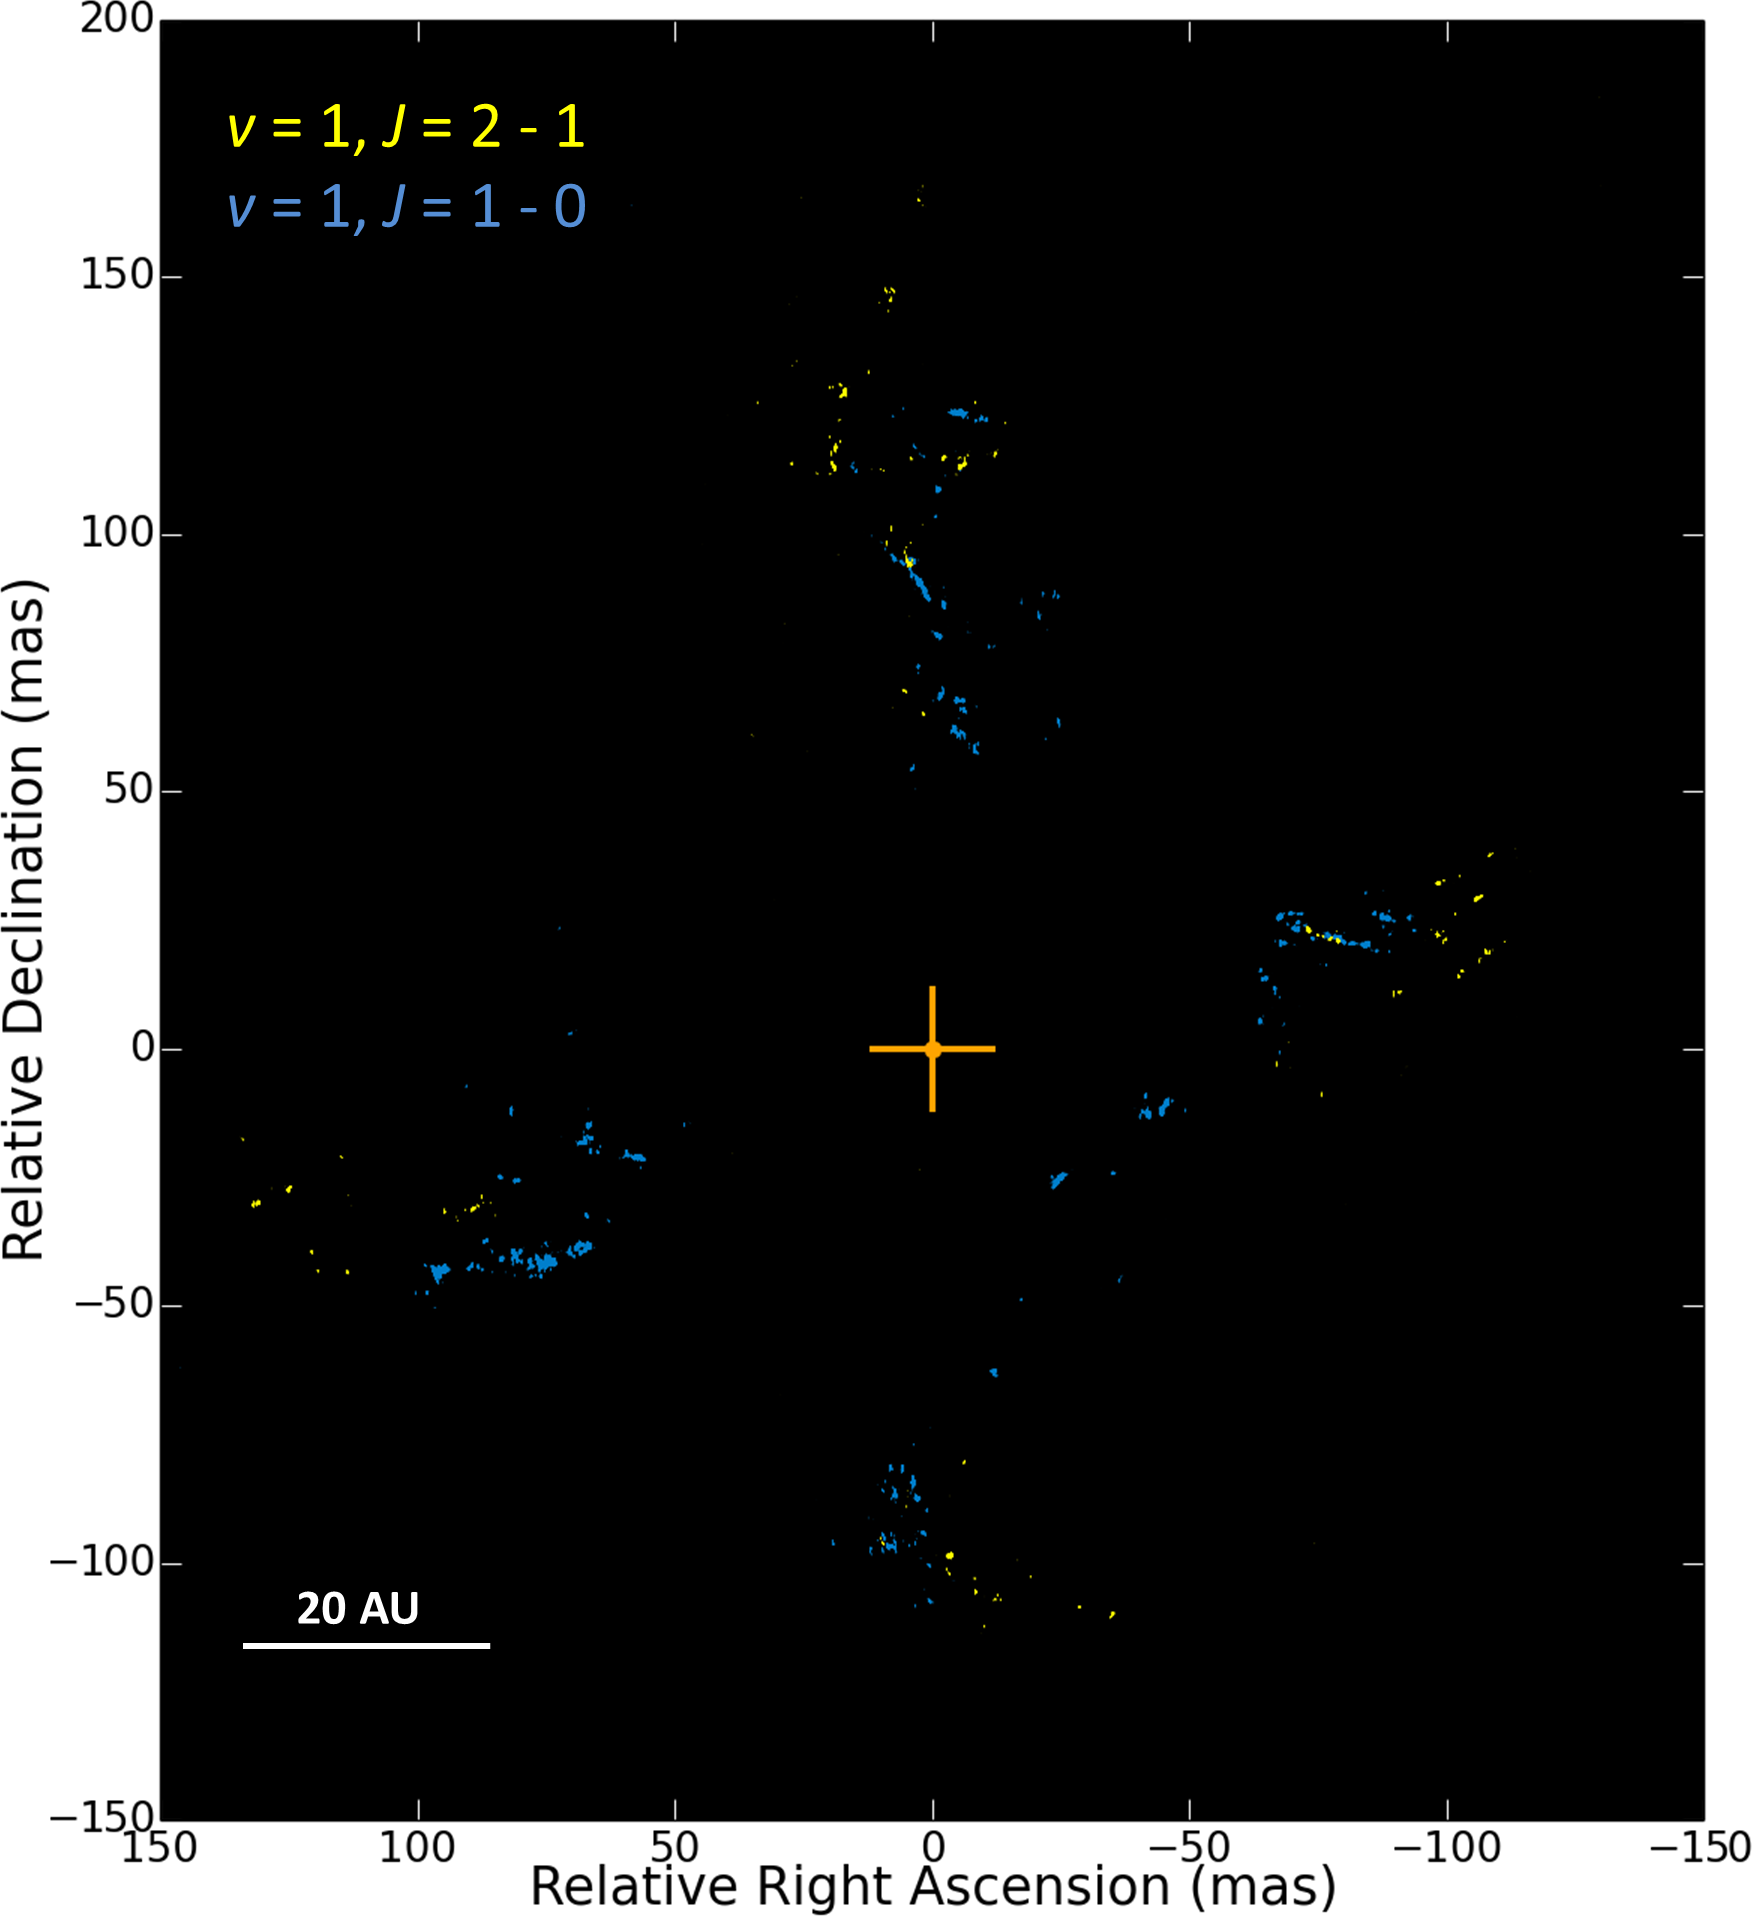
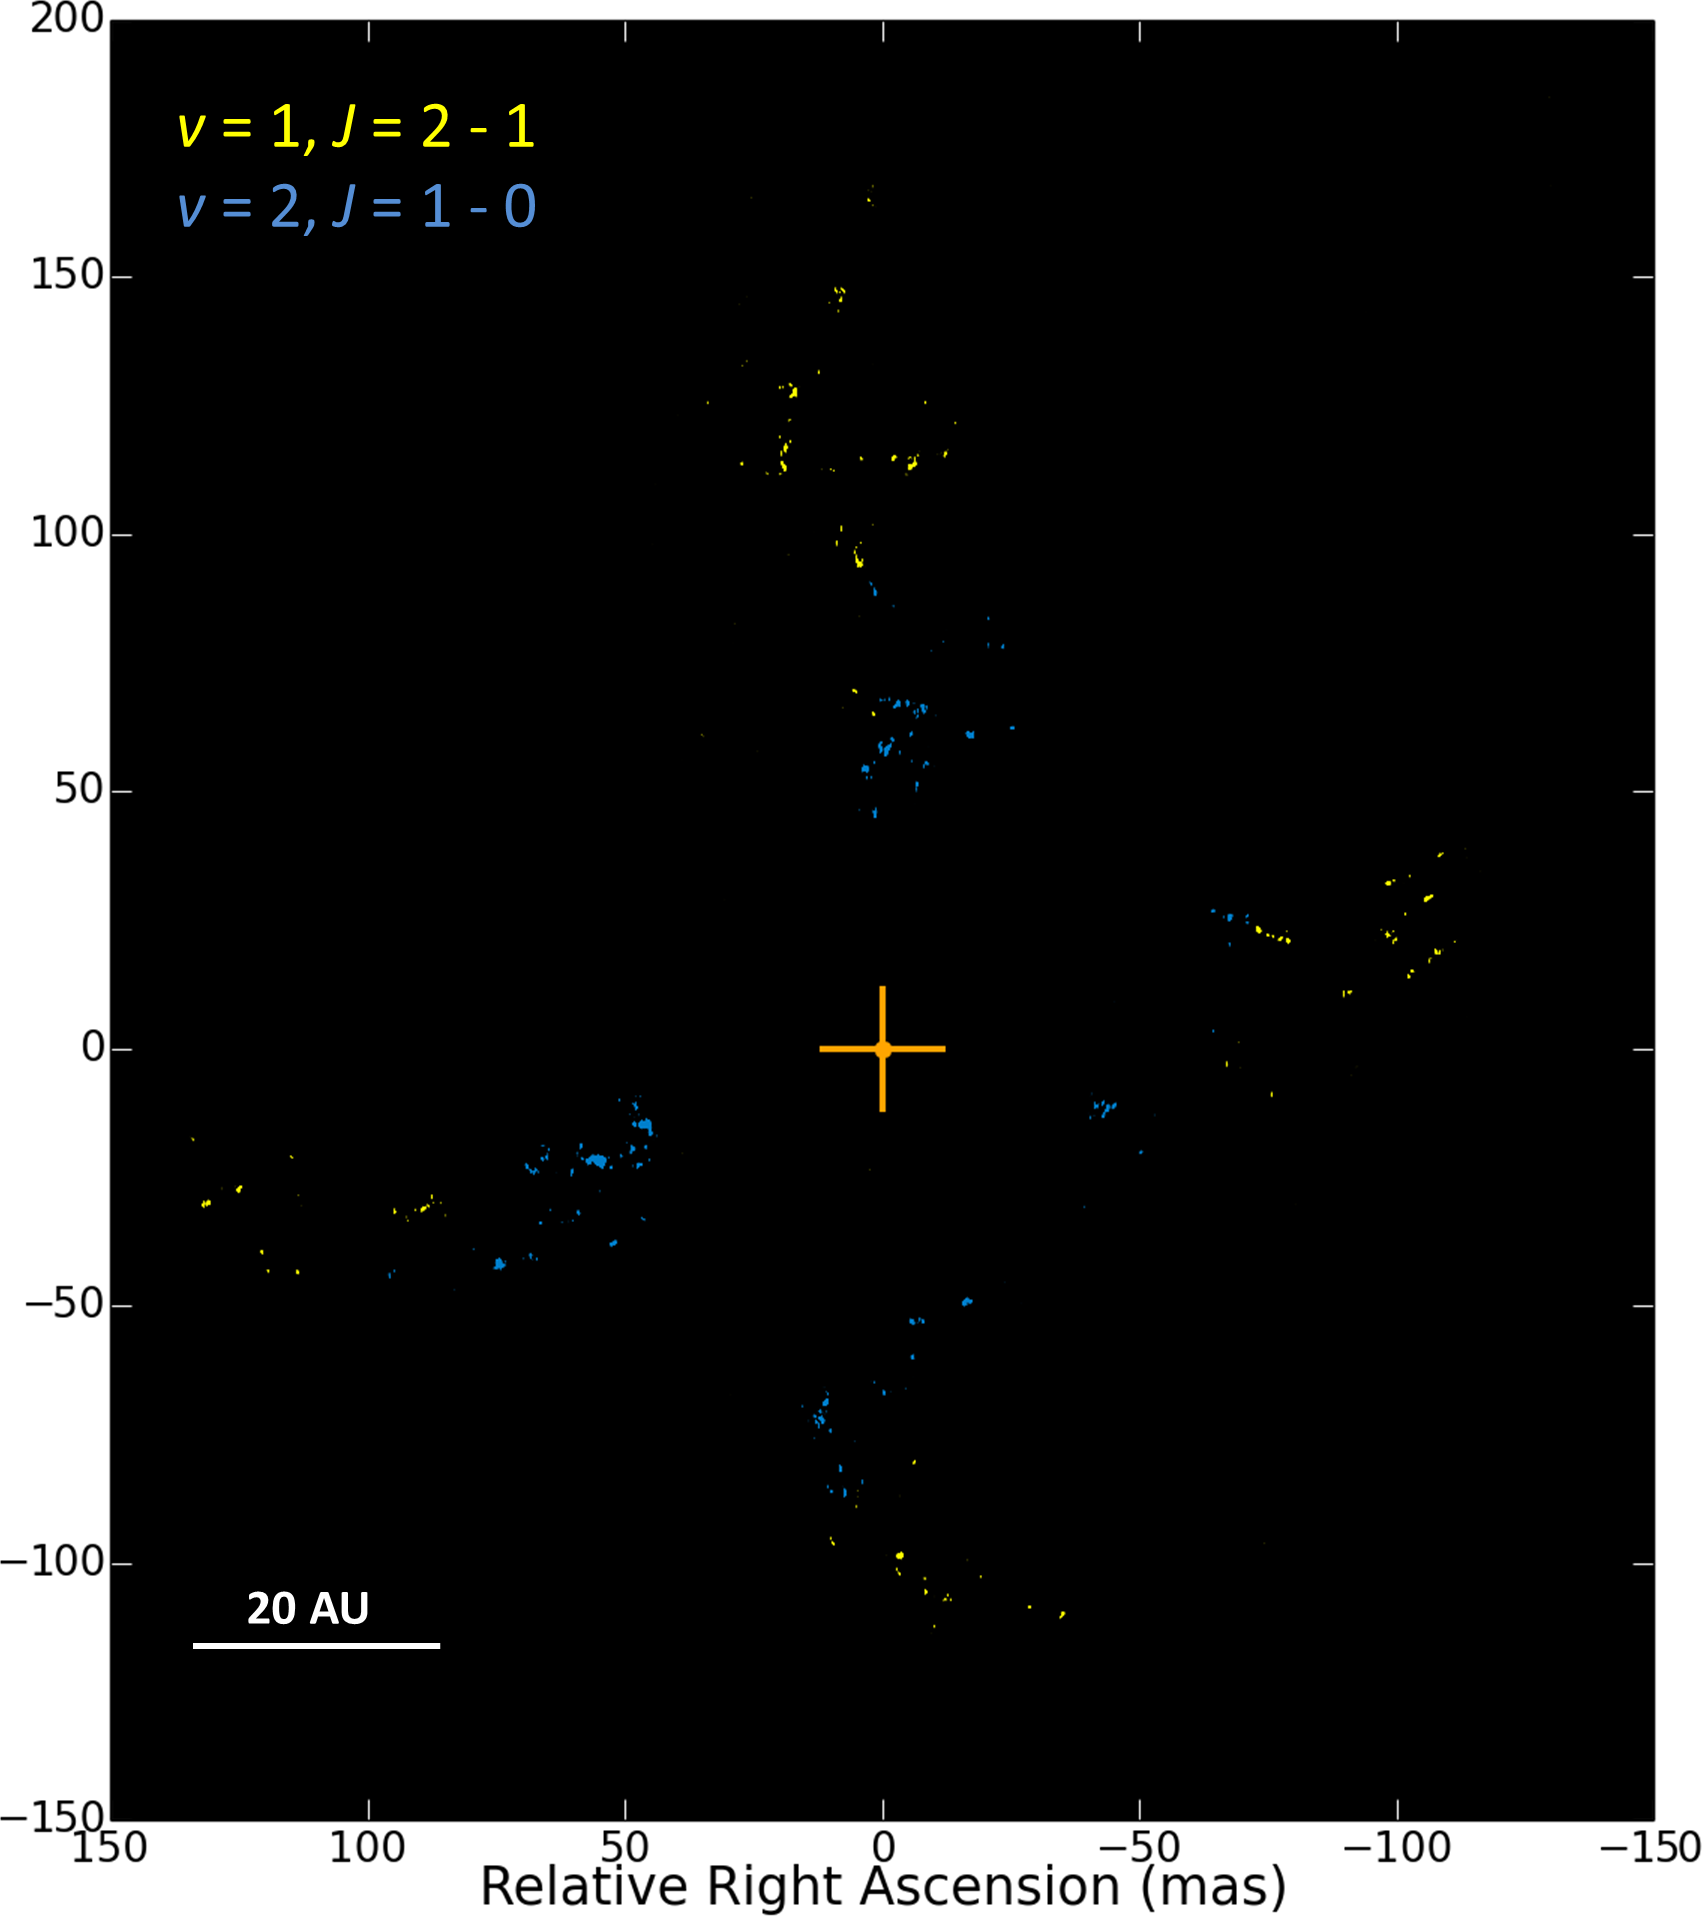
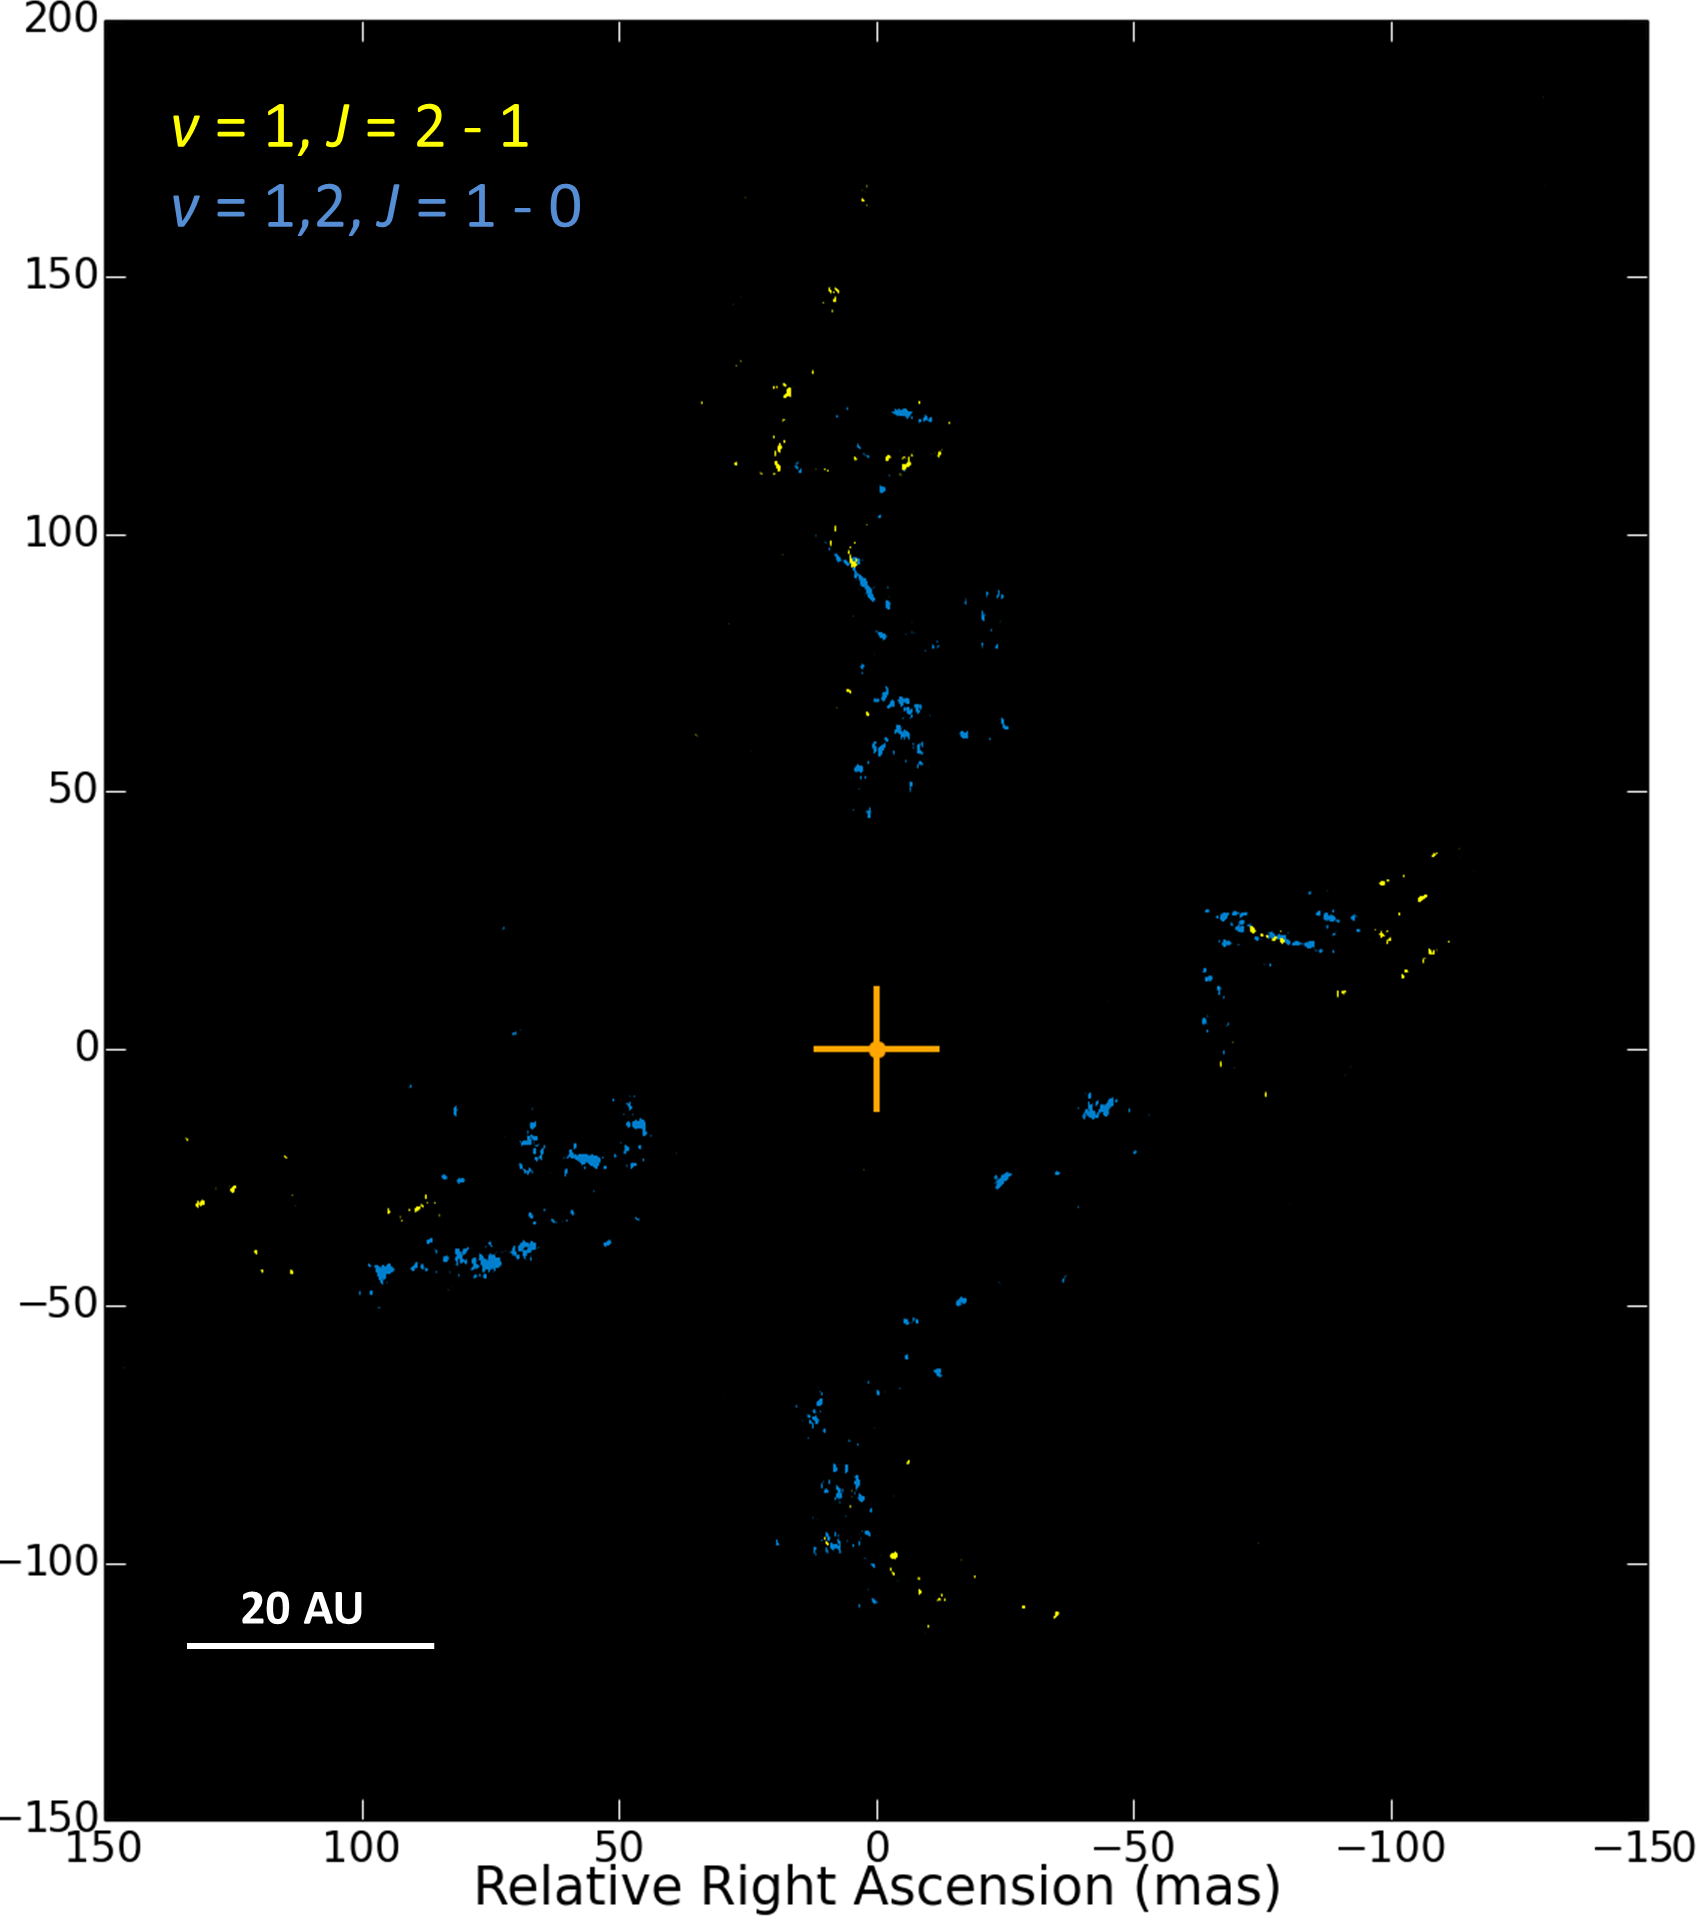
Fig. 1
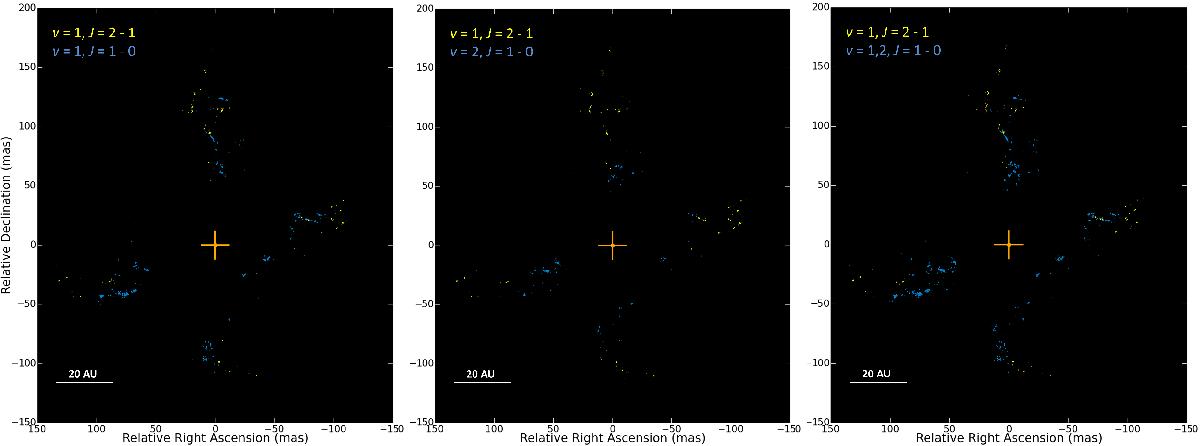
Overlay of the velocity-integrated total-intensity images of 28SiO maser transitions at λ3 mm (in yellow, observed on January 24, 2011, integrated over the velocity range of −14.2 to +27.9 km s-1) and λ7 mm (in blue, observed on October 7, 2002, integrated over the velocity range of −48.1 to +62.3 km s-1): (left) λ3 mm v = 1, J = 2−1 and λ7 mm v = 1, J = 1−0; (center) λ3 mm v = 1, J = 2−1 and λ7 mm v = 2, J = 1−0; (right) λ3 mm v = 1, J = 2−1 and both λ7 mm v = 1 and v = 2, J = 1−0. The cross indicates the estimated position for Source I.
Current usage metrics show cumulative count of Article Views (full-text article views including HTML views, PDF and ePub downloads, according to the available data) and Abstracts Views on Vision4Press platform.
Data correspond to usage on the plateform after 2015. The current usage metrics is available 48-96 hours after online publication and is updated daily on week days.
Initial download of the metrics may take a while.